Click different sells to bring up differnet equations in the same chart

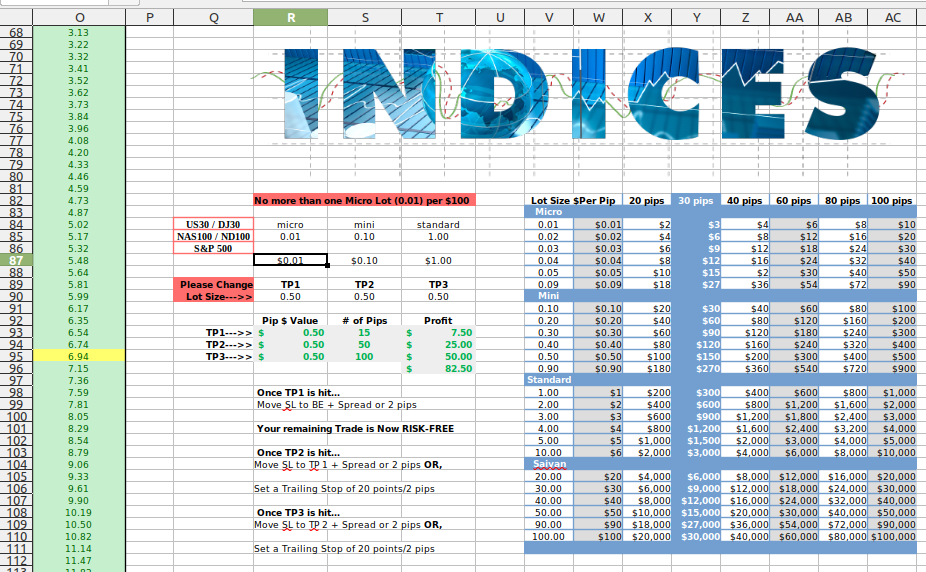
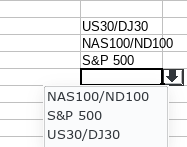
Click On US30/DJ30, NAS100/ND100 or S&P 500 and have

the values of R93, S93, T93 change R93 =R90x1 T93 =R93xS93
(I put an x instead of an asterisk because the forum deletes it)

the values of the Lot Size $Per Pip column W Change according to
micro R85, mini S85 & standard T85

the values of pips 20, 30, 40, 60, 80 & 100 in their respective columns change

Need something to the effect of
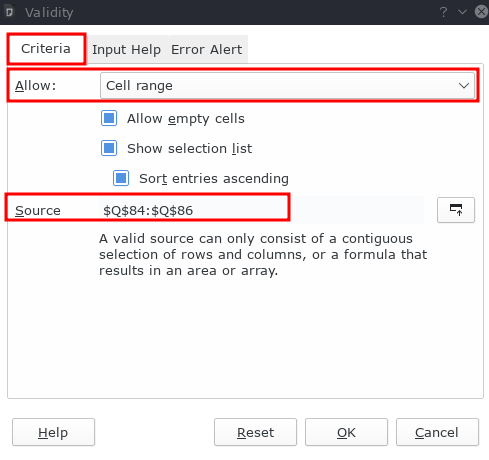
IF Q84 is selected

THEN R87 = X

AND S87 = X

AND T87 = X

IF Q85 is selected

THEN R87 = X

AND S87 = X

AND T87 = X

IF Q86 is selected

THEN R87 = X

AND S87 = X

AND T87 = X

Then these change the entire pip chart to the right in columns V-AC

(http://)

Click On US30/DJ30, NAS100/ND100 or S&P 500

If you want that based on “click” you need a macro and push buttons. Personally I’d vote for a some kind of a of mode selection cell (e.g. cell Q87) with a validity range Q84:Q86 and change everything else based on the value chosen for Q87

How is what you suggested accomplished? That is a bit outside of my current level of knowledge

Pretty easy:

  • Select cell Q87
  • Data -> Validity -> Tab: Criteria
  • Under Allow select Cell range from the drop down
    Set options: [x] Show selection list (optional: [x] Sort entries ascending)
  • Under Source enter Q84:Q86

image description


And you get a cell with a drop down being restricted to allowed values:

image description


Now you could start using `IF()` or better `IFS()` based on the value selected for `Q87` and avoid horrific macro programming.