
I have a line chart plotting a calculated value (Y axis) for each day of the month (X axis). I have defined the data range as the entire month so that I don’t have to change the range for each new entry. The entered data displays correctly on the chart except that after the last entry the line for the the Y value falls to zero. I have unchecked Options > LibreOffice Calc > View > Display zero values. Heeding the suggestion to set empty Y fields to # N/A, I changed the calculation of the Y field to =IF((C9+G9+K9)/3=0,NA(),(C9+G9+K9)/3) and copied this formula into all the cells of the source column for Y values. Nothing changed. Is the equation syntax wrong? This has got to be a fairly common situation; is there a parm that needs to be set somewhere? Is there another solution short of changing the data range each day so it only plots days with data? Thanks for any help you can offer.Sample.ods
Please provide a sample file. Cannot reproduce your claim. Neither with a line chart nor with a XY(Scatter) chart, which is the proper chart type for numerical values on both axis.
I have a sample file read - can’t figure out how to attach it to my question. Sorry, I really am a Newbie here.
Click the edit link (small pencil icon) right of word Comments above and use the paper clip symbol to attach a file:
![]()
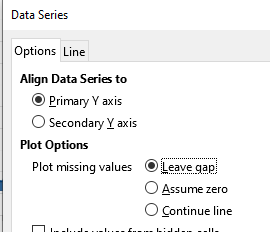
Edit the chart (double click on it),¹ double click in the chart line,² go to the Options tab, and change Plot Options to Leave gap, OK.
¹ Also can select the chart, choose menu Edit - Object - Edit.
² Also can secondary click on the chart line and select Format Data Series….
Tested with LibreOffice 6.4.7.2 (x64); OS: Windows 10.0.
Add Answer is reserved for solutions. If you think the answer is not satisfactory, add a comment below, or click edit (below your question) to add more information. Thanks.
Check the mark (![]() →
→ ![]() ) to the left of the answer that solves your question.
) to the left of the answer that solves your question.
Why not use in N4 =AVERAGE(C4;G4;K4) instead of =(C4+G4+K4)/3?
Also can try with =IFERROR(AVERAGE(C4;G4;K4);""), so you will get no value instead of #N/A.
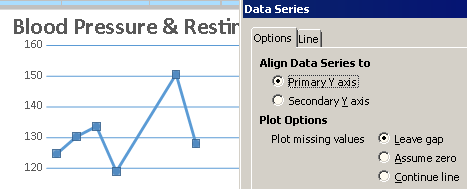
Edit mode > rt click a data line > format data series > options > plot options > leave gap worked perfectly for me. I’ll try the Average command --never used it before. Thank you for your help.
You’re welcome!