
Hi,
I have an up-to-date version of Libre Office calc (i.e. 7.1.0.3 at time of writing) and I have generated a pie chart, but I’d like to change the colour of the individual segments of the pies to different colours. I’ve tried double-clicking on a segment of the pie chart → right click → format data series → Area → then selected a colour and pressed ok, but it hasn’t changed the pie segment to the new colour. Am I doing something wrong?
Kind Regards,
Brian
If you always prefer other colours, e.g. pastel colours, for charts then you can change the defaults in Tools > Options > Charts > Default Colours. See Default Colours help
Thanks for the tip!
Hello
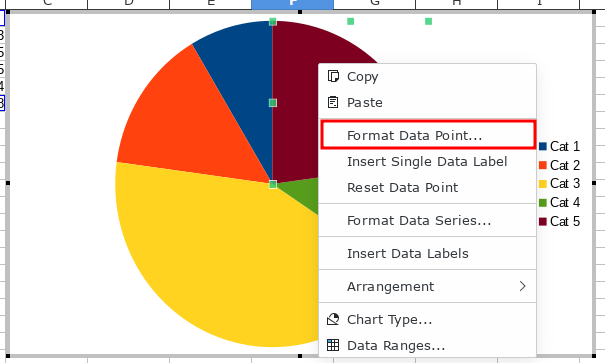
you need to select each data point and not the data series. Then the context menu shows Format Data Point...
Hope that helps.
Thank you, works a treat!
As you have been helped, please help others to know the question has been answered by clicking on the  in upper left area of answer which satisfied the question.