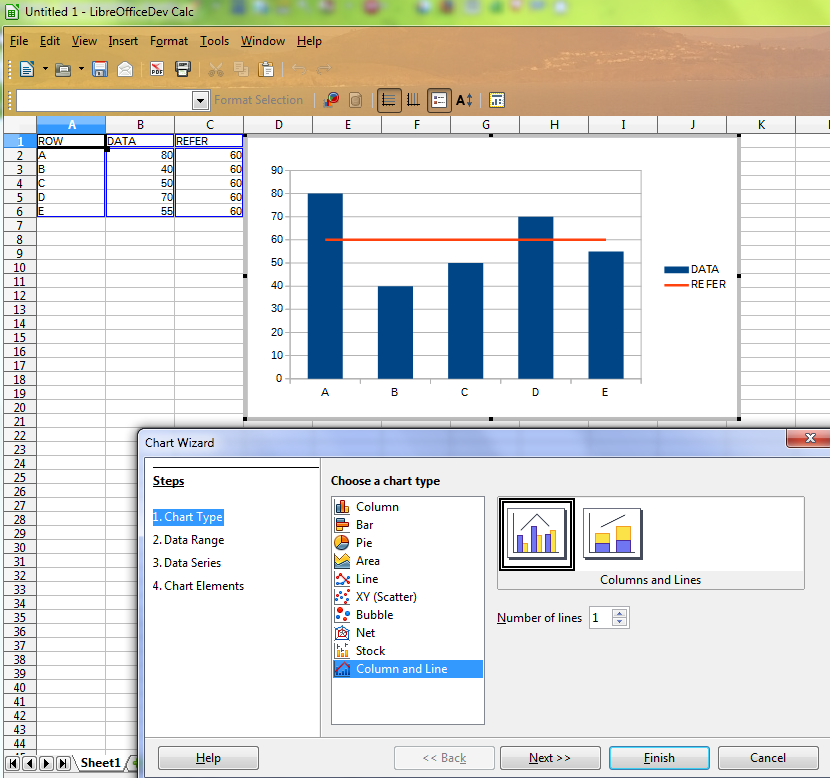
I have created this chart with Calc:
chart
In this case “60” is the “target”, so I would like to show a horizontal line going across the chart at 60, to visualize better how each bar relates to the set target.
How can I add a horizontal line?
Thanks for all help!