Can anyone help to design this graph?

Hello, I am trying to plot a 1D graph of a simple row of data but it is being complicated to convince LibreOffice Calc that my data just have values on the x-axis and not on the y-axis.
The Data:

Location 1	 14
Location 2	 17
Location 3	 19
Location 4	 30
Location 5	 49
Location 6	 55
Location 7	 56
Location 8	 64
Location 9	 72
Location 10 76

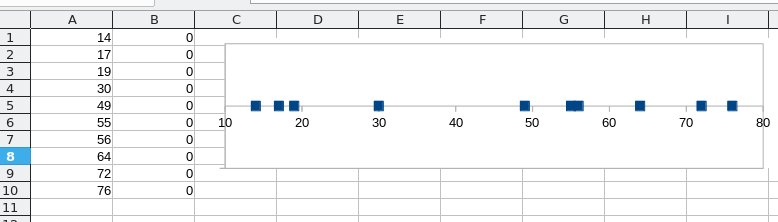
I would like to plot the value of each location in a straight line from 0 to 84 (research things) and just show points of locations, but I am having troubles showing that in the X asis.

Can anyone help me?

(reformatted by ajlittoz)

Make it an X-Y chart:

  • add a second column with constant value, e.g. 0
  • create the X-Y chart
  • customize the Y-axis to get rid of useless decoration, grid lines, …

To show the community your question has been answered, click the ✓ next to the correct answer, and “upvote” by clicking on the ^ arrow of any helpful answers. These are the mechanisms for communicating the quality of the Q&A on this site. Thanks!

In case you need clarification, edit your question (not an answer which is reserved for solutions) or comment the relevant answer.

Thank you very much!!!

You’re welcome.