
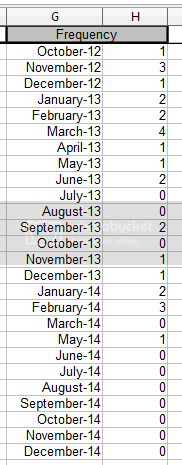
I have been building charts to graph data from year to year. My last two charts are behaving oddly. The first chart is graphing data from columns G107:H118. Column G is just MMMM-YY while column H are numbers from the respective months. There is data directly above and below this range for numbers from previous and subsequent years. The problem with this chart is it will show January-13 through January-14. The next chart is laid out the same way but for the year 2014 (G119:H129). This chart refuses to show January-14 and will only start with February-14. I have compared everything I can think of with the charts that work properly and can’t seem to find a cause. Perhaps a bug? I’m not sure but any help or advice is welcome.
It seems that January-14 is not being recognised as a date. Calc may be seeing it as text.
Are you able to explicitly set the date format for the column?
Format is exactly the same as the other dates. I used the drag down method to populate the dates.
What sort of chart is it? Are you able to try the date values with an XY plot to see if the dates are still not displayed?
Also, are you able to explicitly set the column to date format? (Right click range > Format Cells …)
Finally, are you able to provide screen shots of the erroneous chart and data?
It’s a simple bar chart. I can change the date format in the data and it will reflect accordingly in the chart but the problem still exists.
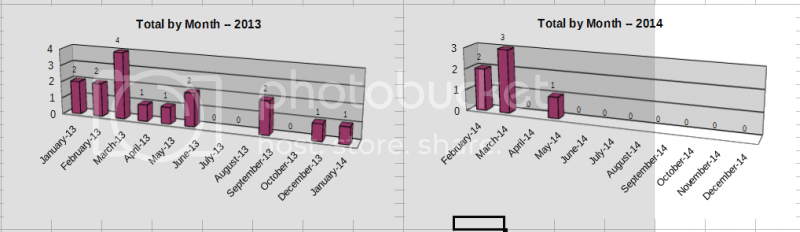
I reproduced the sample data but could not reproduce the problem. That is, my chart for January 2014 forwards displayed January 2014.
I also notice that your April 2014 data is missing.
That said, if G107:H118 includes January 2014 (I presume January 2014 data is in G118 and H118) and you want to include January 2014 in your next chart - so that January 2014 is present in both charts - then the range for year 2014 should be G118:H129 (instead of G119:H129).