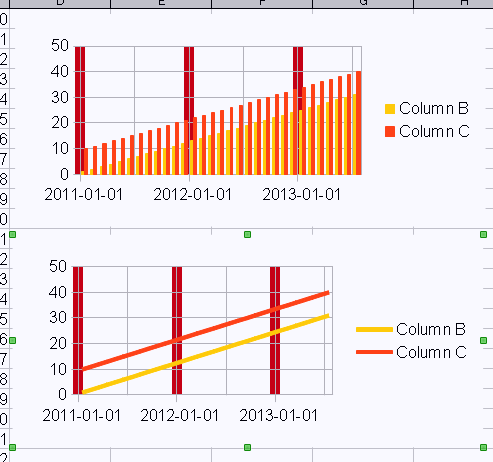
I have a chart showing my households average daily electricity usage for each electricity bill (roughly monthly). The vertical axis is KWH/day and the horizontal is date. In order to make it easier to compare usage year to year I would like to add vertical grid lines separating each year.
When I select the horizontal axis and insert a “Major Grid” or “Minor Grid” it just puts lines between every month (i.e. every data point). This is not helpful. Is there any way to get it to put vertical lines only every 12 data points or even better exactly at the year separation?

