Apparently it used to be Insert>Object>Chart. That’s no longer an available menu option.
I tried Insert>Chart, but that doesn’t bring up the Chart Wizard. And the resulting chart doesn’t match the table data.

Apparently it used to be Insert>Object>Chart. That’s no longer an available menu option.
I tried Insert>Chart, but that doesn’t bring up the Chart Wizard. And the resulting chart doesn’t match the table data.
What is your Libo and o.s. versions?
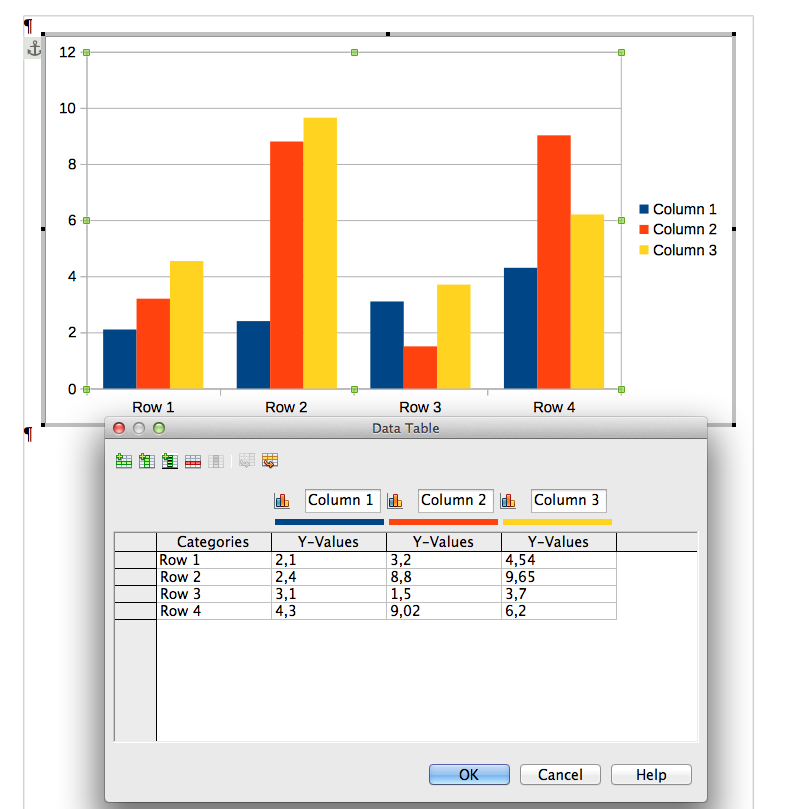
In OSX Libo 4,3,7 it works.
But the the data table chart is not your table, but a wizard table (right clic, Chart Data Table):
If my answer helped you, vote it with  (here on the left)
You can insert a chart and subsequently edit it in steps. I is not connected to a table in ‘Writer’ or any data source. As far as I know there isn’t even any support for pasting values from elsewhere into the ‘DataTable…’ of the chart. Thus I never generated a chart directly in a text document, but always didi it in a Calc document. As soon as you copy such a chart from a spreadsheet and paste it into the text document it is automatically and irreversibly converted to the Data-Table.variant.
The inserted chart seems to be a simple copy of an internal template. You have to edit everything best starting with the type.
Disregard this comment and the one above which I no longer can edit… I obviously had missed a lot.
Charlie, I’m using LO 5.2.5.1 on Win7Pro.
Inserting Charts says, “In a Writer document, you can insert a chart based on the values in a Writer table.” But…
It seems the table-to-chart feature is just not available anymore.
I first was badly informed. But regarding the hint by @Regina the chart using the table containing the text cursor in ‘Writer’ as its ‘Data Range’ was correctly created (with a flaw concerning the automatic scaling of the x-xis).
This with LibO V5.3.1 under Win 10.
Your cursor needs to be inside the table, when you call Insert > Chart.
I tried that various time and since that didn’t work, I wrote the OP above. (Thanks for your comment, though.)