
Hello,
would like to make a chart in Calc. This is what i need to do:
- there are several sheets in the document, more will be added
- every sheet contains some cell values that i want to graph, for every sheet i need a group in the chart
- a separate sheet would hold only the graph
- every time a sheet is added the graph should update automatically
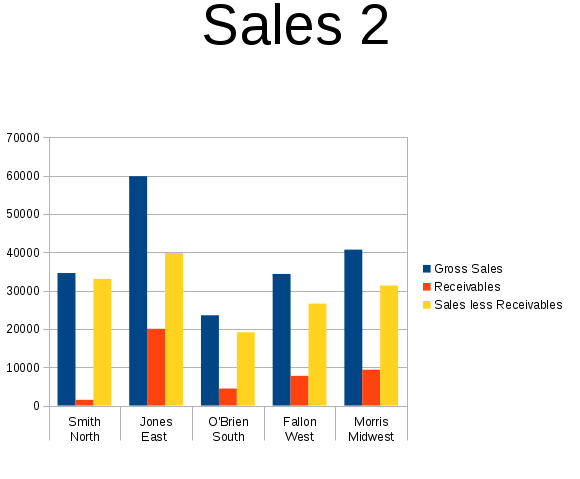
Basically i want something like this
is there a way to do this?