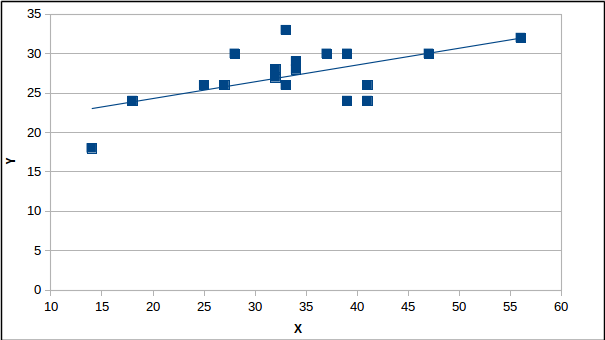
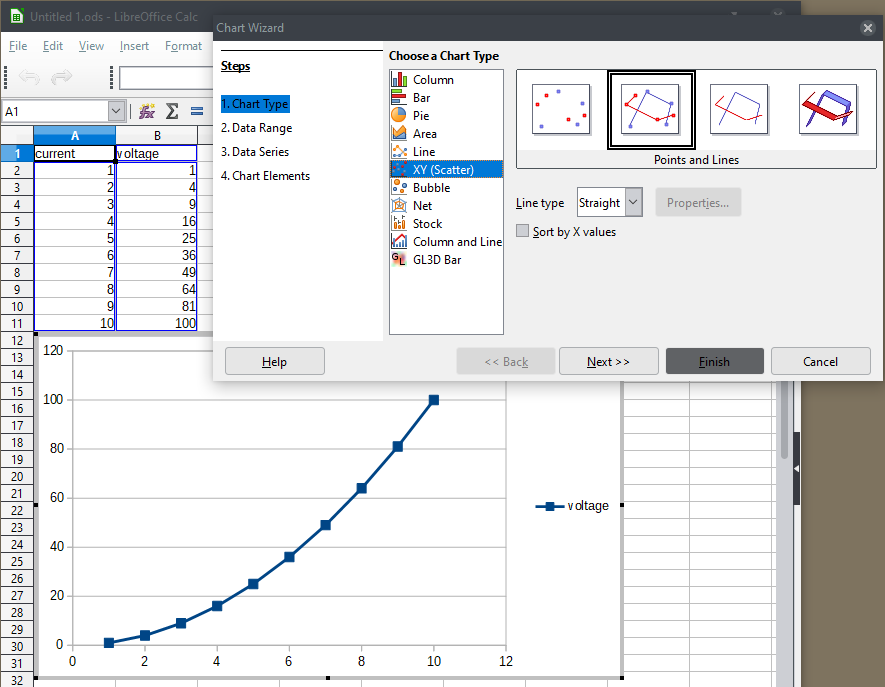
I have two data columns which I would like to compare on a chart. Say current and voltage. I do not want a stacked chart. When I use a scatter chart, I get a jumble of connected lines. What I want is a single line showing the relation between the two columns.
EDIT:
Thanks for your suggestion [editor’s note: referring to @jimk’s answer] but the current column is ordered like a time series. If the current column were not in numeric order then I don’t think it will work.
Here is a copy of some of my data.
33	26
34	29
56	32
47	30
33	33
18	24
39	30
41	24
28	30
37	30
34	28
32	28
41	26
27	26
25	26
32	27
14	18
39	24
I would copy my scatter chart but it does not seem to copy.