Has this been removed from the most recent version?
If not, how do i find it on this version.
If so, will it be returning in the future?
Cheers,
Clayton
Could be old tomorrow!
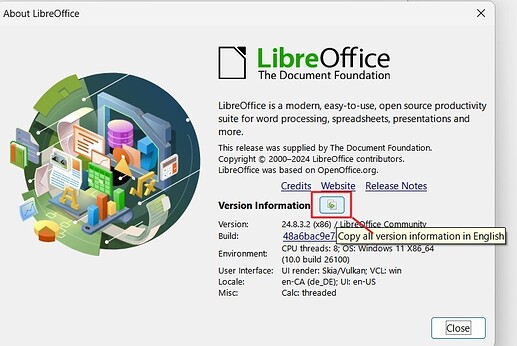
Give us the information listed under Help → About LibreOffice.
Version: 24.8.3.2 (x86) / LibreOffice Community
Build ID: 48a6bac9e7e268aeb4c3483fcf825c94556d9f92
CPU threads: 8; OS: Windows 11 X86_64 (10.0 build 26100); UI render: Skia/Vulkan; VCL: win
Locale: en-CA (de_DE); UI: en-US
Calc: threaded
… and what makes you suspect that something was existing, but has been removed? I.e., what specifically was working for you in which version, in which way, and what do you see now - be specific, like “Previously, there was a menu entry Foo → Bar in Calc, which is missing now”, or “Pressing Fx button did X in version …, and does Y now”, or “double-clicking something in the sample document that I attach here does nothing for me, while in version X, it did Y”…
Thanks,
Version is 24.8.4.2(X86_64)
Build bb3cfa12c7b1bf994ecc5649a80400d06cd71002.
I have previously been able to edit charts in calc by clicking on the chart, then right clicking.
This gave a drop down menu, at the bottom of which was an “Edit Chart” option.
Clicking on this allowed me to click on an icon on the task bar next to the Insert Chart icon that allowed me to edit the data in the chart, specifically data ranges.
By clicking on the axes, these were editable also.
The new drop down menu has none of these options, and the task bar icon next to the Insert Chart icon has gone.
Hope this is helpful.
Many thanks,
Clayton
Thanks, Pierre.
The change doesn’t seem to be mentioned.
It could well be that my previous version was from a while back!
Clayton
The method and the names are the same from 6.4.7.2 to 25.2
- Right click on chart and select Edit to go into edit mode for the chart. You could instead double click the chart to go into edit mode
- Right click on an element of the chart to get edit options for that element. You normally also get the item Data ranges
Thank you.
Unfortunately, the pop up window that appears when right clicking no longer contains an “Edit” option.
Double-clicking the chart has the same effect as right-click>Edit
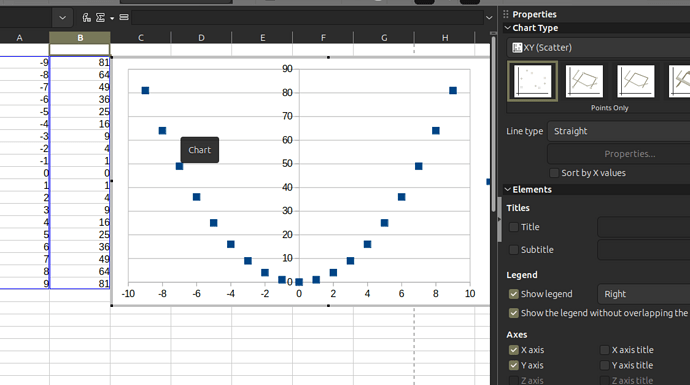
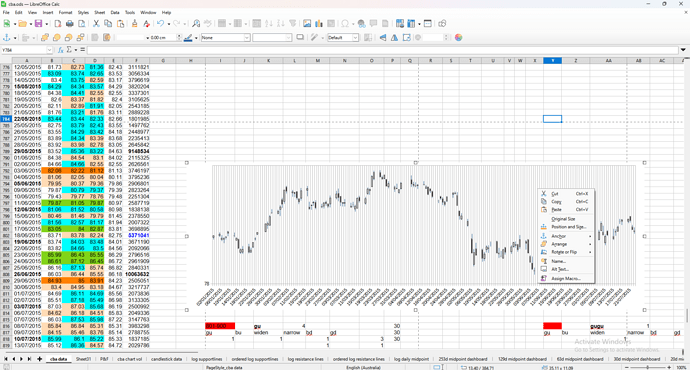
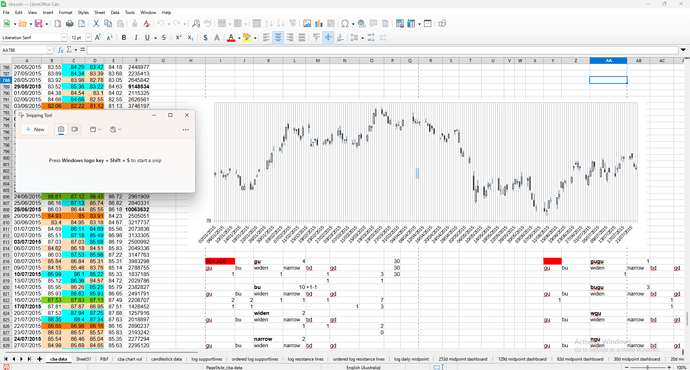
Looks like the selected object is not a chart, but something like an image of a chart.
Up until a couple of days ago, I have been editing it multiple times per day, pretty much every day, over many months using the “Edit” function on the popup menu that appears when I click and right click it, and then the “Data Range” button (which enables me to type in the new range) on the task bar at the top. The Data Range button has vanished since the upgrade.
As I add historical data to columns A - E, I edit the data range so the most recent ~140 rows are displayed.
Since upgrading (and perhaps even the evening before the upgrade??) this hasn’t been possible.
All charts on all sheets (vertical bar, scatter, and candlestick types) are affected similarly.
Try using the Safe Mode (in the Help menu), to see if that’s some profile corruption. If it works using safe mode, then you may have to reset the profile to restore the working state.
Same result in safe mode, I’m afraid.
On the upside, I am learning some techniques to add to switching it off and then back on again (which I’ve tried).
Does it also not work with a new chart, which you create and then try to re-enter the edit mode?
Thanks. Mike.
This appears to have solved it. Was able to create and edit a new chart.
Thank you for your patience!
Kind Regards,
Clayton


