Does anyone know how to fix the problem of the chart disappearing when I hide the referencing data rows please?
Version: 7.6.4.1 (X86_64) / Windows 10

Does anyone know how to fix the problem of the chart disappearing when I hide the referencing data rows please?
Version: 7.6.4.1 (X86_64) / Windows 10
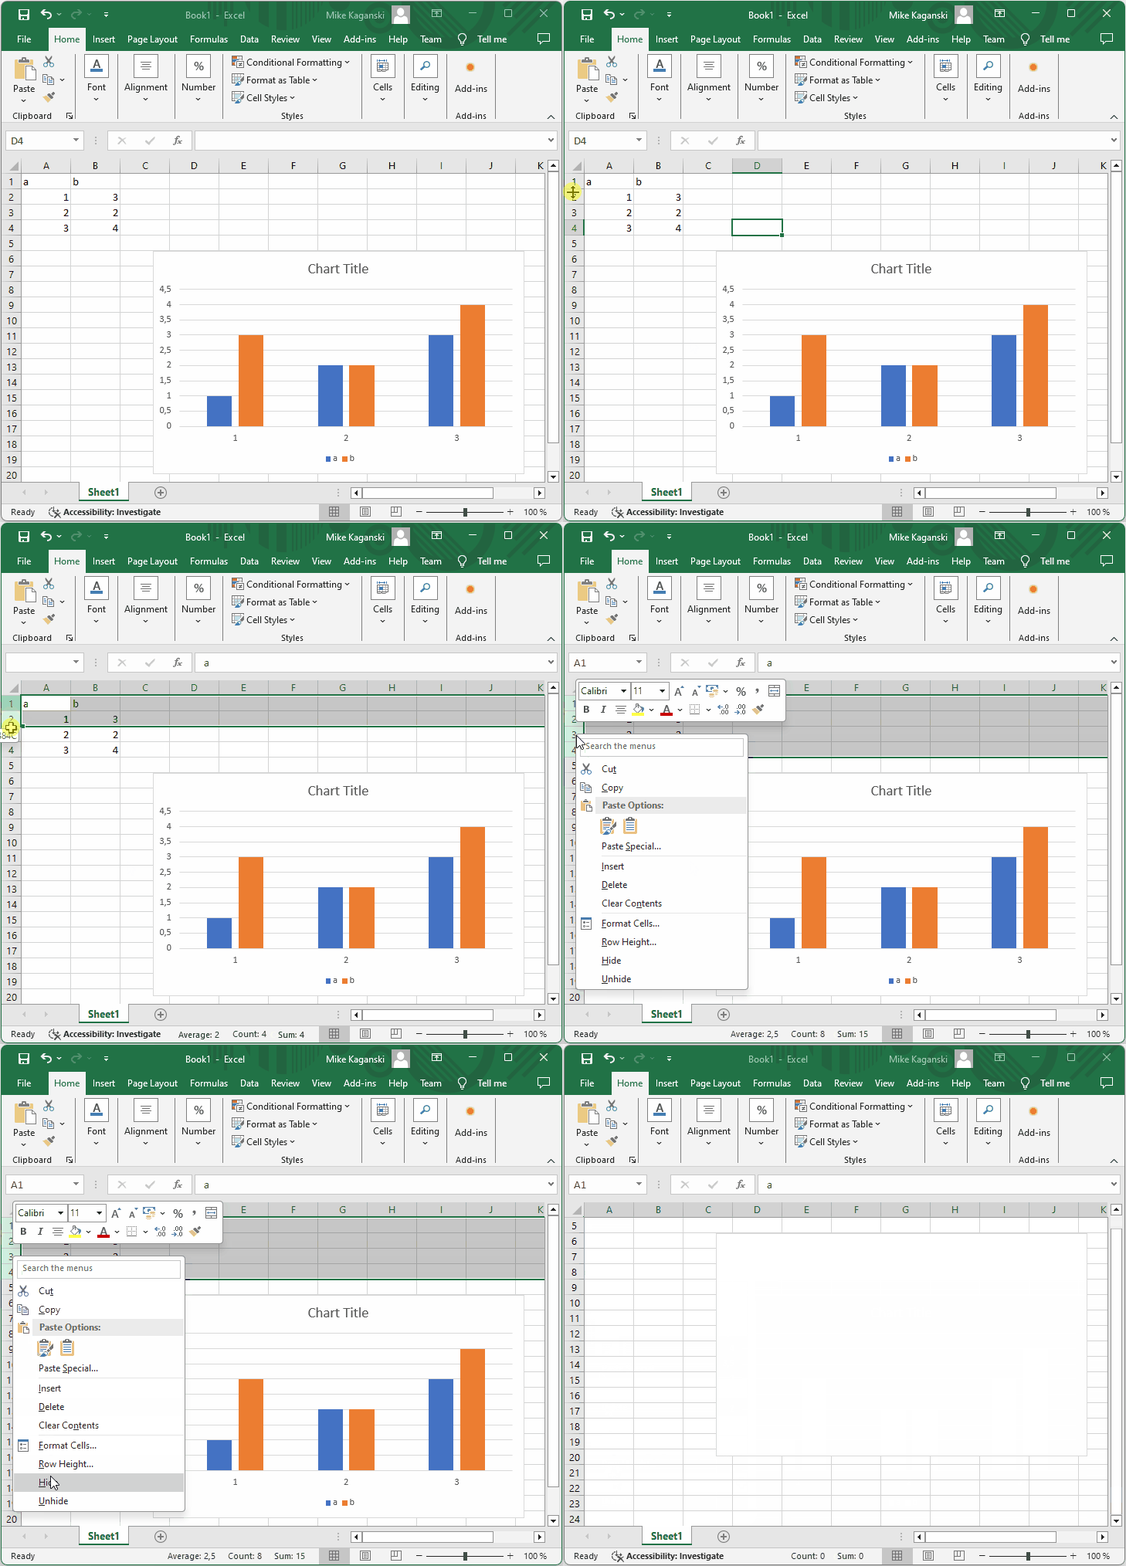
Chart shows only visible rows data; it is thus possible to filter the chart by hiding several rows/columns with source data.
Put the chart to another sheet, so that the source data doesn’t have to be shown on the same sheet.
Mike thank you for a prompt response.
It is somewhat disappointing though that that is the case with LO.
The additional sheet is an acceptable workaround
or I can just make the data rows smaller and use the chart to sit over the top of the data I guess. 
 It’s interesting, how someone’s “it’s great that I can do this with LO!” is another’s “it is somewhat disappointing” … Note that this feature provides additional flexibility. The cost is - you hide data not for decorative purposes, but for actual filtering. And there are so many ways one can do things in spreadsheets (like defining print ranges to not output data; putting data far to the right out of sight; using dedicated sheets - the best…), that this seeming “inconvenience” actually helps you to build good workflow, avoiding things like “use the chart to sit over the top of the data”, which would be another awkward workaround, which will cost you hours trying to figure what is going on, say, a year from now, when you need to change something.
Mike I hear you as I guess we are all different with varying expectations.
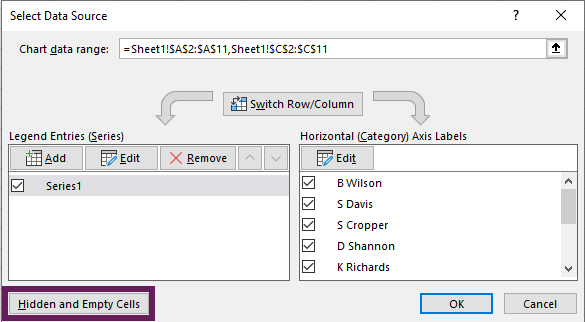
I think the ability to turn on or off the inclusion of the data that is hidden would be the best and simplest way. I think that is how it is done in Excel??
And yes revisiting in a years time could be fun trying to find the “lost data” Now where did I put that data??? 
I like far to the right as well. Learning all the time. Thanks
Yes. There is a question today with exactly that problem, 17 hours to solve.
No.

Mike thank you but that is incorrect


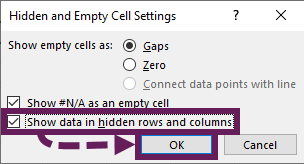
That’s it, that’s all it takes. The chart information is now visible again. Take a mental note of the additional settings in the Hidden and Empty Cells Settings dialog box; you never know when they might be useful.
Villeroy this is what I have been looking for in LO but cannot find it in Version: 7.6.4.1 (X86_64) / Windows 10
I do note some reference to it’s existence in version 4
here
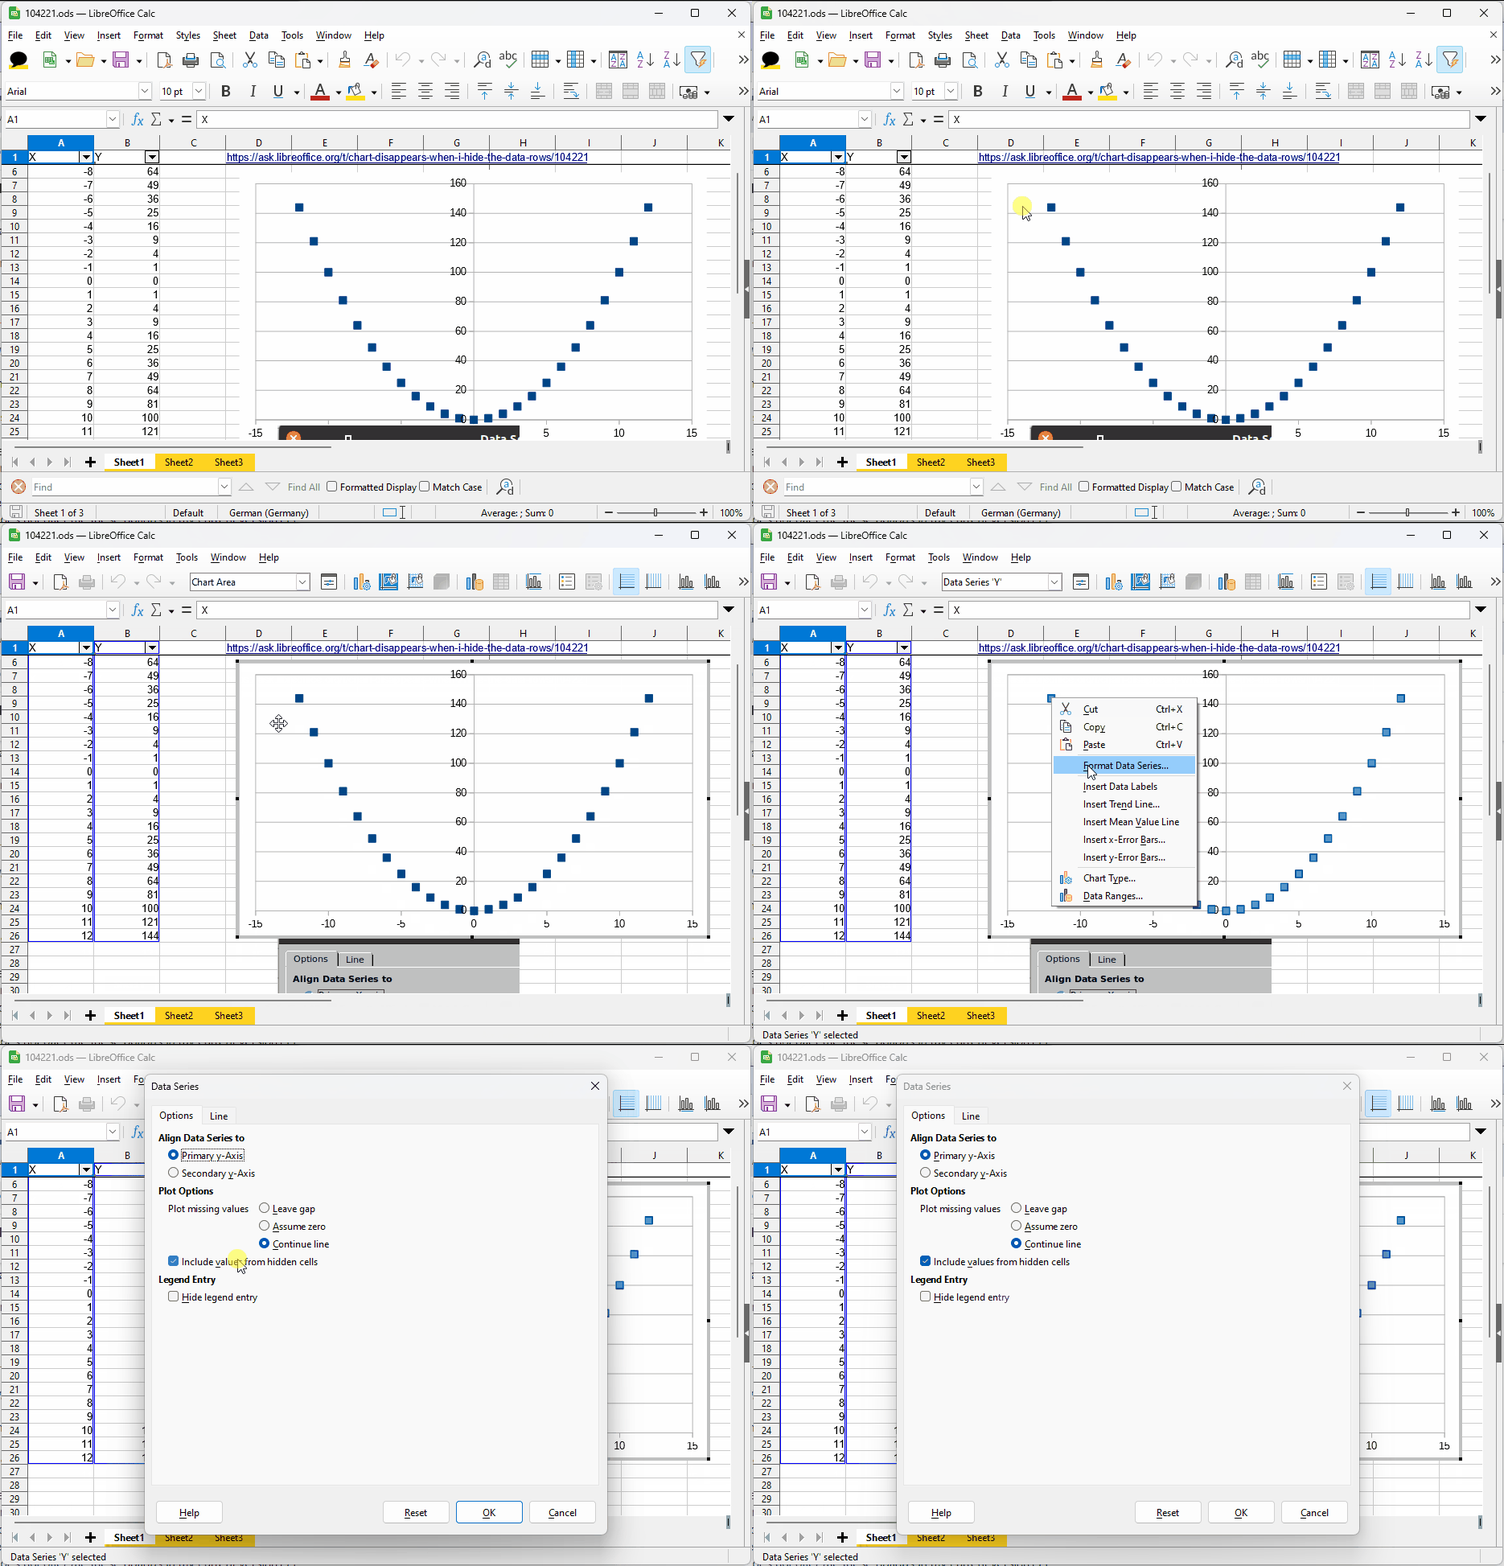
Select the data-series from the drop down menu in the chart-editing task bar (in the upper left corner by default) and click ‘Format Selection’. Click on the ‘Options’ tab and check the ‘Include values from hidden cells’ box. Worked on LibreOffice Version 4.0. 2.2.
from here Calc: Hide columns but use data
But this does not offer me these options in my current version???
It is there in e.g. Version: 24.2.2.2 (X86_64) / LibreOffice Community
Build ID: d56cc158d8a96260b836f100ef4b4ef25d6f1a01
CPU threads: 24; OS: Windows 10.0 Build 22631; UI render: default; VCL: win
Locale: en-GB (ru_RU); UI: en-GB
Calc: CL threaded

When I right click on the chart I am offered a dropdown with Edit as the last item so I click on Edit and nothing happens save a small jump on the screen. I have been searching for that Data Series dialogue box offering the choice to Include values in hidden cells but just cannot locate it???
Did you see the screencast, where I first selected the chart, and then double-clicked it to enter its editing mode?
Mike yes that is what I had been doing but the Format Data Series box was not presenting BUT I now know why.
I initially was trying to restore the missing graph lines after i had hidden the data rows (obviously I did not have a problem until I did this and they disappeared)
BUT then I tried to start again by Unhiding with the chart then restored and the data rows visible again. So I double clicked ion the chart to get it into Edit then right clicked all over the chart BUT not on the actual Data series graph lines? It was not until I watched your video that I noticed that is what you were doing to generate the Format Data Series dialogue box, at last. This requirement was not mentioned in the advice I found online so I was left scratching my head, until Villeroy chimed in that it indeed is possible and then you further demonstrated exactly how to do it.
So a huge thank you to both of you for your sage advice, it is much appreciated.
Hopefully it will help someone else who encounters the same requirement.
At first sight, a chart is just another shape. A shape is some rectangular object attached to an office document. When you click a shape once, you get 8 handles in the corners and in the middle of each side.You can drag a shape around. Dragging a handle resizes the shape.
Most shapes allow you to edit the shape’s text content when you double-click on them. Shapes with charts open the chart for editing when you double-click or right-click>Edit.
Once the chart is in editing mode, you get an additional toolbar.
You can select individual chart elements. A double click on an element opens a dialog to edit the properties of the selected element.
The toolbar has a list box which makes it easier to choose the right element, and the button next to the box opens the properties dialog.
Clicking anywhere in the embedding office document leaves the chart editing mode, or just hit the Escape key until the focus in back in the document.