Hello,
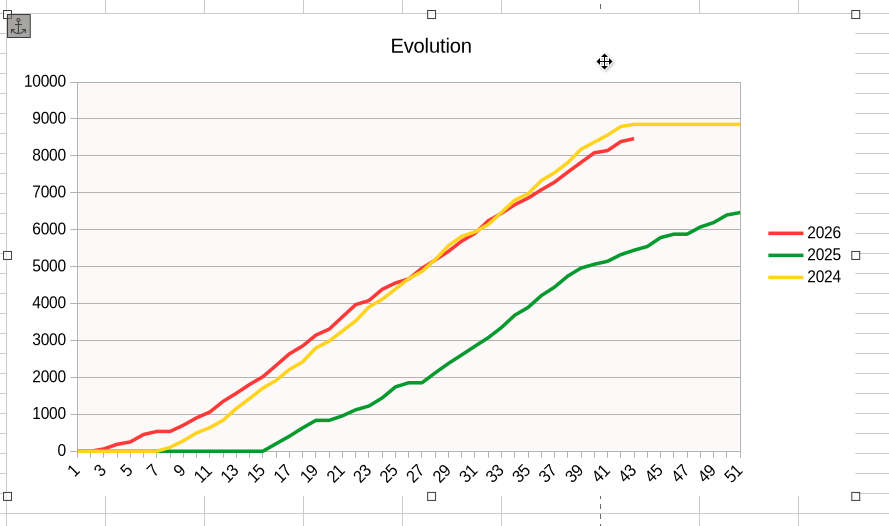
My aim is to create a chart showing the number of kilometres cycled per week and comparing the figures for the current year with those for the previous years. Nothing too complicated. In Excel, I have a macro that populates the chart using arrays rather than cell ranges.
So I tried converting my Excel file to a Calc file and rewriting the macros. Initially, everything went fine. I created a chart in Calc, copied it to Writer, and then copied it back to Calc in order to get an editable Data Table. See this post
The problem I’m encountering is the following: the line representing the current year should not show data points that lie in the future, whereas the other lines should show all weeks.
After creating the chart as described above, I manually cleared the cells in the second column, from row 44 to row 51, of the Data Table.
I then retrieved the data using:
aData = oChart.EmbeddedObject.Data.getData()
Now, the array elements aData(43)(0) through aData(50)(0) all contain the value 2.2250738585072E-308.
So I concluded that, in order to hide the future data points, I simply had to assign this value to the corresponding array elements. Right? Well, it turned out that wasn’t the case. When I write the array back to the Data Table, these elements are kind of converted (?). As a result, the data points are not hidden; instead, the line drops to zero. And now I’m stuck.
Here’s the code, stripped to the bare minimum:
Option Explicit

Sub TryToHideSomeDataPoints()
Dim oChart As Object, aData() As Variant, i As Integer

oChart = Thiscomponent.Sheets.getByName("Graph").Charts.getByIndex(0)

 'Retrieve the data from the DataTable.'
aData = oChart.EmbeddedObject.Data.getData()

'Put the data back without modification'
oChart.EmbeddedObject.Data.setData(aData)

msgbox "The graph has not changed"

'Give the elements for datapoints to hide the value (which they already have !?) '
For i = 43 To 50
     'aData(i)(0) = 2.2250738585072E-308 'Throws a runtime error.
     aData(i)(0) = 2.2250738585072 * (10 ^ -308)
Next

'Put the array back into the DataTable.'
oChart.EmbeddedObject.Data.setData(aData)

msgbox "The graph has changed, due to putting back the same values (?)"

End Sub
TestChart.ods (38.2 KB)
Can anybody offer any suggestions?