Hi there,
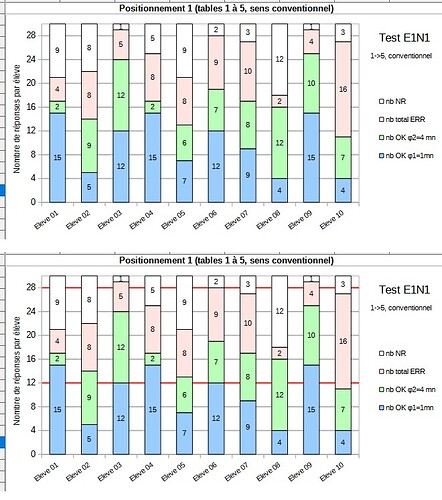
I want to highlight specific lines of my Y axis in a chart.
What could be the way to do this for y=12 AND y=28 values ?
Thanks for helping me 
(both red lines have been added with image-editing software to simulate what I want to get)
An approximation could be using “Column and Line” chart type, with two additional data series each having a constant value over all points… That would not start and end at axes, and the lines would be in front of the bars.
Thanks, but this tip is not convenient for me…any other way ?
Crossposted:
Hi @LeroyG,
I have slightly changed my first question, because it appeared that it probably could not be possible to solve my initial problem.
Nor with Calc, but with Draw.
Copy the chart and paste it in Draw, convert to curves, ungroup, then change the lines color.

very smart…  but not possible for me.
I’m trying to create an automated calc file to distribute test results into 4 groups, and a specific view to some determined values.
For my first graph the values are ok, I can use the secondaryaxis option (value=12, repeat 2 times : 24 appears)
Problem for my second graph : the y values which must be used are 12 and 28…
And it’s obviously not possible for me to say to the future users “copy and paste into draw”
Thanks once again for your help, anyway
Maybe you can do it with an easy trick.
Create two charts, one with a transparent background, and the one with lines in the background, with the same size and position, only with the lines without any labels.

