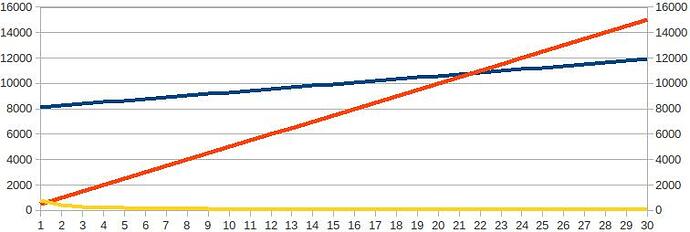
Please provide more info. Can you post some sample data and explain what would you like to do? Also what is your LibreOffice version and what is your operating system name/version?
- Right-click on the graph > Edit.
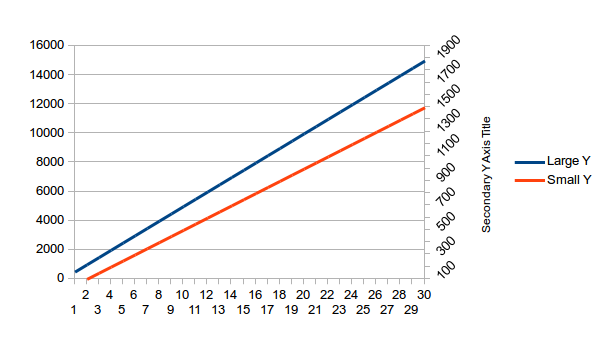
- Right-click on Secondary Y Axis > Format Axis… > Scale tab
- Uncheck Automatic option against Minimum and enter “100”.
- Uncheck Automatic option against Maximum and enter “2000”.
- Uncheck Automatic option against Major interval and enter “100”.
- Click OK.
- Right-click on the smaller data series (e.g., the yellow line?) > Format Data Series… > Options tab > Align data series to select Secondary Y Axis > click OK.
For data like this (rename from JPG to ODS) the result should be similar to:


