Hello,
Your question had me revisit converting my Base charts to complete some of the conversion to Python. Since Base Forms are basically Writer documents, I thought I would produce a sample for you. What started out to be a small project has taken up more than my entire day! First, here is the code I present:
#!/usr/bin/env
import uno
import sys
import os
import time
from array import array
from com.sun.star.awt import Point
from com.sun.star.awt import Size
from com.sun.star.text.TextContentAnchorType import AT_PAGE
from com.sun.star.text.VertOrientation import NONE
from com.sun.star.text.HoriOrientation import NONE

def create_chart(*args):
    doc = XSCRIPTCONTEXT.getDocument()
    textFrame = doc.createInstance( "com.sun.star.text.TextFrame" )
    text = doc.Text
    textFrame.Width = 11000
    textFrame.Height = 7500
    textFrame.AnchorType = AT_PAGE
    textFrame.RelativeWidthRelation = 1
    textFrame.RelativeWidth = 100
    textFrame.SizeType = 1
    textFrame.VertOrient = NONE
    textFrame.HoriOrient = NONE
    cursor = text.createTextCursor()
    text.insertTextContent(doc.Text.End,textFrame,0)
    textFrame.Text.String = chr(13)
    textObject = doc.createInstance( "com.sun.star.text.TextEmbeddedObject" )
    textObject.setPropertyValue("CLSID","12dcae26-281f-416f-a234-c3086127382e")
    textObject.Name = "ChartID"
    textFrame.getText().insertTextContent(textFrame.Text.End, textObject, False)
    docChart = textObject.EmbeddedObject.Component
    docChart.Diagram = docChart.createInstance("com.sun.star.chart.BarDiagram")
#problem area in follow:
    rowDesc = ["a","b","c","d","e","f","g"]
    docChart.Data.setRowDescriptions(rowDesc)
    colDesc = ["First", "Second"]
    colDesc[0] = "Third"
    colDesc[1] = "Fourth"
    docChart.Data.setColumnDescriptions(tuple(colDesc))
    myData = [[100,150],[200,50],[300,270],[400,63],[500,82],[600,645]]
    docChart.Data.Data = tuple(myData)
#problem area above
    chartTitle = docChart.getTitle()
    chartTitle.String = "Sample Python Chart"
    docChart.Diagram.getAxis(0).getAxisTitle().String = "Some Stuff Here"
    docChart.Diagram.getAxis(1).getAxisTitle().String = "Maybe Distance"
    docChart.HasLegend = 1
    myDoc = XSCRIPTCONTEXT.getDocument()
    embeddedObjects = doc.getEmbeddedObjects()
    chartObject = embeddedObjects.getByName("ChartID")
    chartSize = Size(15000,6500)
    chartObject.setSize(chartSize)

g_exportedScripts = create_chart,
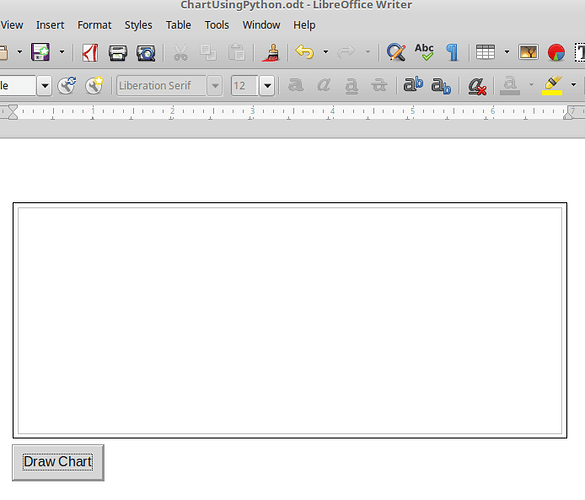
This code works without a problem in a Base Form. However, there are problems in a Writer document. The code will finally work, but when first executed it starts out as:
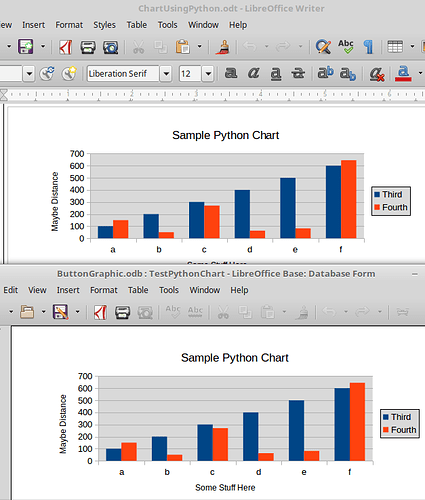
Now I like to use charts inside frames because it is easier to manipulate, so that is what is seen. When the inside of the frame is clicked on (where the chart actually is) Writer crashes. When recovered through the normal recovery process the Chart appears complete. Here is the chart in both Base & Writer:
The frame on the Base chart is harder to see since it goes to the edge of the screen. Both were done using the same code. Base appeared instantly & writer crashes but can recover to successful display. The problem area is indicated in the code; The Row/Column descriptions & the actual data. Even if only one (any one) is present - crash. Been trying all day with searches & not finding anything. This may be why you only find Python code for Calc. I actually never found any for Base. Devised this over a long period.
You can find my post here regarding charts in Base forms. It contains samples and the basic code in the samples. The code actually has many optional settings for charts and the code for different chart types.
Well, at least this may give you a starting point.


 (upper left area of answer).