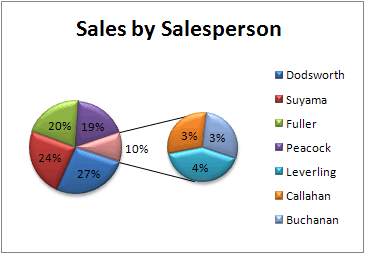
I’d like to create a graph with two pie charts, the second one representing the contents of a single slice of the first pie. E.g. First pie chart would be number of males and females in a group and second pie chart would show some characteristics of only the male group. Is that possible? Or will I need to create two separate charts and glue them together in some image manipulation program?
I’m trying to accomplish this in LibreOffice Calc v5.0.3.2 running in Windows 7

