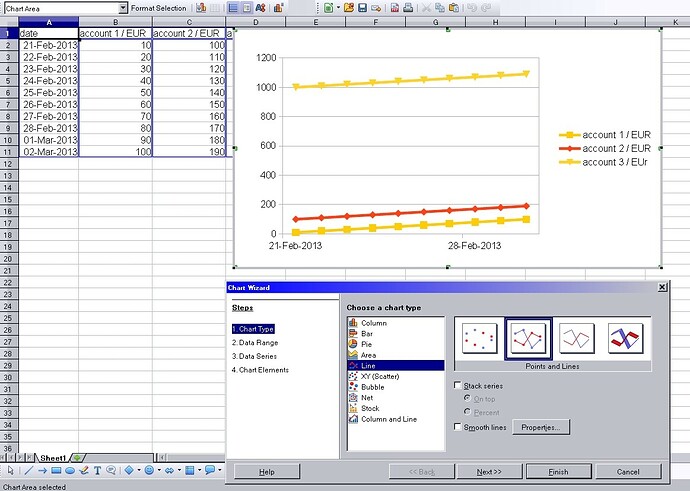
I have two sets of Data:
Total balances of account 1 with their respective dates and total balances of account 2 with their respective dates.
Of course the dates of the data for account 1 and account 2 can be very different.
E.g.
Dates of Account 1: 01.01.01; 02.01.01; 30.01.01
Balances of Account 1: 0$; 2$; 3$
Dates of Account 2: 01.01.01; 05.01.01; 25.01.01
Balances of Account 2: 2$; 5$; 3$
Now I want to create a Chart where I can see the balance of each account at each time (connected with normal lines). (So e.g. blue line is for Account 1 and red line is for Account 2, since both balances are in a similar range, these two lines should be next to each other horizontally)
What is a good and particularly flexible approach? (Later on, I might add more data to each dataset)
Edit: Thanks for the answer so far. The problem is that Account 1 and Account 2 can have different dates.
So Account 1 has dates: 1. Jan, 2. Jan, 30. Jan
And Account 2: 1. Jan 5. Jan, 25. Jan
I don’t want to fill in the missing dates and I have many many X values, so it’s not feasible to use markers.


