I am creating a pivot chart (simple column style) from a pivot table that is based on a daily log table with one entry per row. Each entry in the log has a date, some numerical values, and a severity level. The pivot table layout uses the dates as a row field, the numerical values as data fields, and the severity level as a page field.
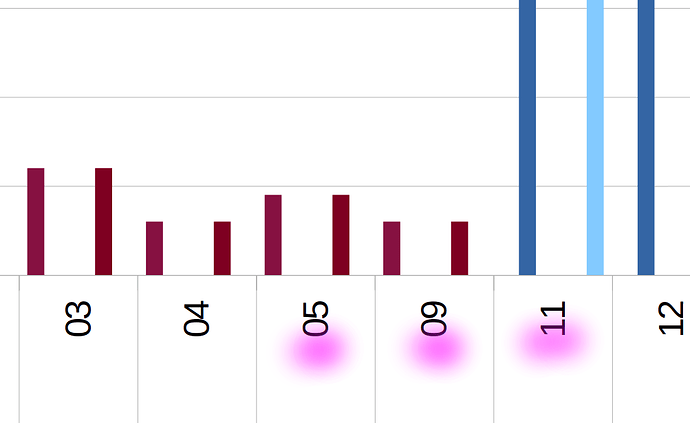
If the page field is set to a specific severity value, say “warning”, only matching rows are included in the pivot table. That’s to be expected and all well. However, the resulting pivot chart is visually hard to make sense of, because at the X axis, days without a “warning” event are completely skipped.
See this screenshot where days 6, 7, 8 and 10 have no place:
I have fiddled with the “ignore empty rows” option in the pivot table layout, but it was already unchecked and doesn’t seem to have any effect on this.
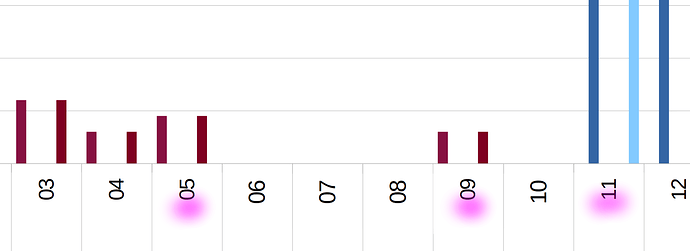
For a more intuitive chart view, I actually want the X axis to keep linear pace across days that have no matching entry, like in this (gimped-up) picture:
**Is this feasible - and if so, how?**


