I have created a spreadsheet that has one line chart with 2 dataseries. The chart was created using various macros. The creation and initial setup of the chart went well. Now I am trying to change the dataseries from the default. So far I have only been able to change the line colour. I want to be able to change the line type and width, as well as the icon type, colour, and size.
There are lots of VBA solutions, but I have not found any LibreOffice Basic solutions.
Any help or direction would be appreciated.
John Crawford
I wouldn’t expect that many users(contributors) here have sufficient knowledge to answer the question “from stock”. Most of those who want to help will need to work with an example.
To avoid “Chat___ answers”: Attach an example (as .ods) containing the source ranges and the code you have.
Thank you for your response. I have gotten together a spreadsheet that shows where I currently am. In the process I have learned a few things. I was able to find the properties for the dataseries so I can set the colour, width, and type (SOLID, DASHED) of the lines. I cannot, however, format an icon on the lines. Line 51 of the macros sets all lines to the same symbol. I need to be able to display, or not display an icon. There is a property called style, which I think will allow this control, however I do not know how to set it.
The spreadsheet id called “Line Definitions.ods”. Just click the button, and it will create a chart. It will show 2 lines, one red, and one dashed blue. There are also a number of diamond symbols. I have disabled the displaying of lines 3 and 4, but Line 51 seems to ignore that. If you uncomment line 151 and click GO you will see the curr
Line definition.ods (13.1 KB)
ent problem
Hi, you can make the symbols disppear by
oSymbol = oXDataSeries.Symbol
oSymbol.Style = com.sun.star.chart2.SymbolStyle.NONE
oXDataSeries.Symbol = oSymbol
P.S.: the API constants are case sensitive.
oXDataSeries.linestyle = com.sun.star.drawing.LineStyle.SOLID
works
.Symbol is a structured property of the series. You can’t change the value of any subordinate property directly.
Assign the whole structure to a variable, edit/update/set the named “fields” contained in it, and finally assign the complete edited structure to the series again.
Example (Also see correction below!):
oSecondSymbol = oXDataSeries
oSize2 = oSecondSymbol.Size
oSize2.Width = 500
oSize2.Height = 1000
oSecondSymbol.Size = oSize2
oSecondSymbol.Style = 2
oSecondSymbol.StandardSymbol = 6
REM And so on ... Finally
oXDataSeries.Symbol = oSecondSymbol
For another example see (e.g.) subchapter 6.12 of “Useful Macro Information” by Andrew Pitonyak.
CORRECTION:
oSecondSymbol = oXDataSeries.Symbol
...
ms777
Thank you for your reply. But especially about the constants. It really bothered me that what I thought was typed correctly, was not. Lesson learned!
Lupp
Thank you for your reply and snippit. I did, however have to add the following line
oSecondSymbol = oXDataSeries.Symbol
to get the symbol.
Now another question. The structure allows some symbols, however there are more (e.g Plus, X, dot). Is it possible to select one of these symbols?
Again, Thank you to both of you.
Hmmm…
First time that I paste an image:

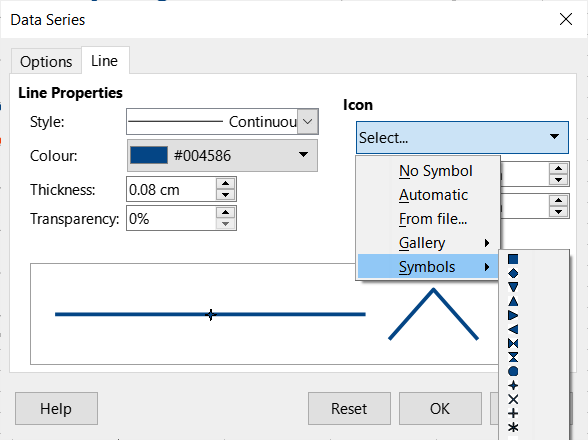
In the dialog for formatting a data series you find under the title Icon an item Symbols and there a graphically exemplified pile of choices. The symbols shown there don’t have names for use in macros, but have 0-based indices usable as the .StandardSymbol designator.
For example you can count there and find that the graphic looking like a plus sign has the index 11.
BTW: If the suggested solution works for you, you should check-mark it.
And please: A new question deserves a new topic.
…inconsistent and probably misleading.
What about the cases 5 vs 11 shown by your link e.g?
Of course, I cannot guarantee that the indices I have obtained by counting will also be valid in future versions. It seems to be a jungle.
[I won’t pretend I master the details here  ]
]
your link is about filter/excel/xlchart, not the actual Calc ODF chart, is it ?
ps.
hurrah!
Well, I don’t want it to become a habit.
After my last post, I just tried entering numbers higher than 7. It works up to 15, and matches those in the diagram. Thanks to all who have commented on this, and sorry for trying to sneak in another question.
John
…and sorry for trying to sneak in another question.
I have to correct me:
In this case the added question was well fitting under the topic.
How this is handled in detail will remain a question of estimation.

