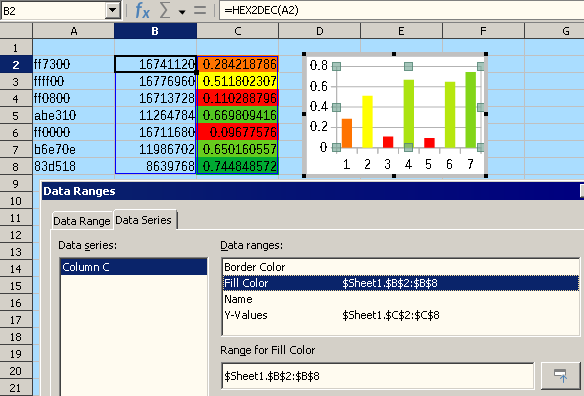
Trying to have a Bar chart to mimic a Format conditional color scale and / or apply a conditional format color scale to a chart?
Updated thanks to @ouyang.leyan’s hint (upvoted).
Still a little handwork is needed:
- Select the cells with the conditional format color scale applied (column C), and export it as PDF.
- Import the PDF in Draw.
In Calc: Secondary click on the chart, chooseEdit, click on the bars.Click on the n-th data point node, secondary click on the data point and chooseFormat Data Point….- In Draw: Copy Area color Hex code from n-th “cell”.
- In Calc: Paste it
in Area colornext the Fill Color data range of n-th bar (column A). - Repeat for the next bar from step 5.
-
Add the formula
=HEX2DEC(A2)in column B. - Edit the chart’s Data Range to add Range for Fill Color.

Tested with LibreOffice 6.4.7.2 (x86); OS: Windows 6.1.
It would be great if someone finds a simpler way.
Add Answer is reserved for solutions. If you think the answer is not satisfactory, add a comment below, or click edit (below your question) to add more information. Thanks.
Check the mark (![]() →
→ ![]() ) to the left of the answer that solves your question.
) to the left of the answer that solves your question.
I am not sure I understand exactly what you mean, but the fill color can be taken from a cell, so you just need to configure a formula to get the corresponding color in the cell. You can have something like =IF(A2>2,HEX2DEC("ff0000"),HEX2DEC("00ff00")) in order to have a red bar for values above 2 and green bar otherwise, then apply this to the whole column of values.
It will not be dynamically linked to the conditional formatting though (you need to update your formula if you update your formatting).
