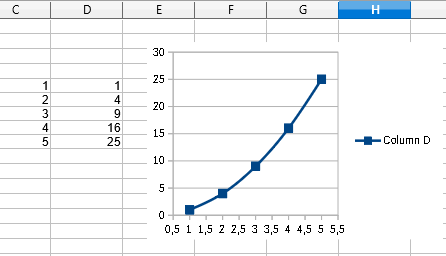
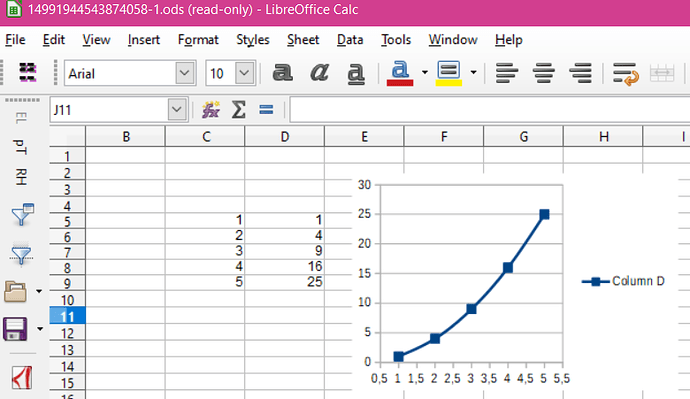
Charts in Calc showing as OLE icons

I am using LibreOffice 3.5.7.2 Build ID: 350m1(Build:2) under Ubuntu.
I have plotted some data in Calc, which was initially displaying correctly as a chart. However, the chart is now no longer visible, but is displayed only as a transparent grey bordered box with a small “OLE” document icon at the centre. All the data is still there and can be edited and formatted without a problem (the is correctly displayed during editing!), but as soon as I click away from the chart the boxed icon is again all that is visible. I have searched for a solution online and also looked through all the menu Options for a solution but am unable to find one. This problem occurs on all of my spreadsheets, so it seems to be is global issue. Does any know how to set the charts to display as normal please?

Here is a test file which does exhibit the issue — test.ods - and a screen dump of the chart, as it appears
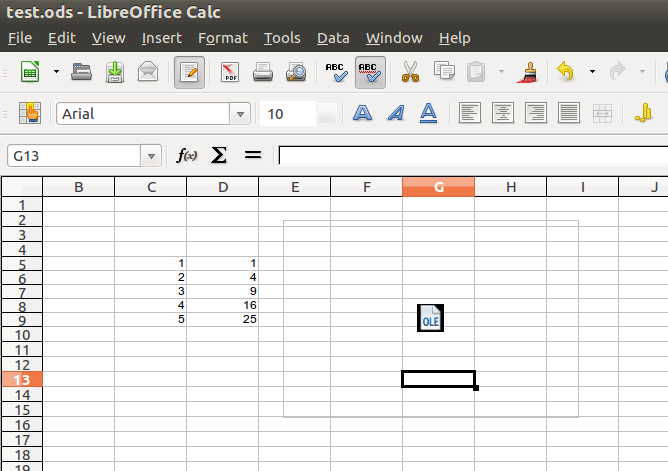
screen.png

Please test the options on Menu/Tools/Options/LibreOffice Calc/View - Objects

Edited 20170704

No problem here.

image description

Looks something is wrong with you installation.

Please test reinstalling.

edited 20180318

No issue here with your file.

Thanks very much for your help. In answer to your question… In Menu/Tools/Options/LibreOffice Calc/View - Objects, all three of the drop down boxes in that section; “Objects/Charts”, “Graphics”, and “Drawing Objects”, are already set to the “Show” option.

Please try resetting the user profile, sometimes solves strange issues.
https://wiki.documentfoundation.org/UserProfile
Usually it’s enough renaming/deleting the file “user/registrymodifications.xcu”, it affects all the options in Menu/Tools/Options, and the files “user/basic/dialog.xlc” and “scrip.xlc” are overwritten, additionally custom colors in “user/config/standard.soc” are lost.

Thanks for your continuing help… I tried resetting my user profile as you suggested. I closed LO, renamed “user/registrymodifications.xcu” and then restarted Calc. A new file was created, but unfortunately the charts were still showing as boxes-with-icons. I then tried renaming the entire “user” directory in the same way. Again, a new directory was created as the program restarted - but with still no effect on the charts. (The View-Objects options were still at “Show” after both attempts.)

Please can you share a sample file with the issue?

I will send you a Cakc file on Sunday, as I am away from the computer at the moment. I actually have about 6 Calc spreadsheets - all of which have this same problem, including a very trivial Calc which I made just as a test case to make sure it wasn’t a problem in the calculation itself. I can send you this one. There doesn’t seem to be a way to attach files to comments - what is the best way to get it to you?

I have voted you question, so I think you have now enough karma to edit your question and attach the file.

Sorry about the longer than expected delay - here are the files. A copy of test.ods, which appears as shown in the image screen.png… Thanks again.

Any solution for this? I’m having exactly the same problem. Thanks.