I am using LibreOffice 3.5.7.2 Build ID: 350m1(Build:2) under Ubuntu.
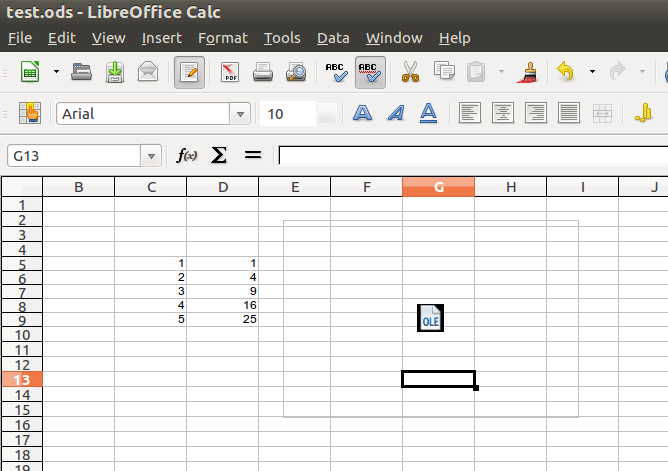
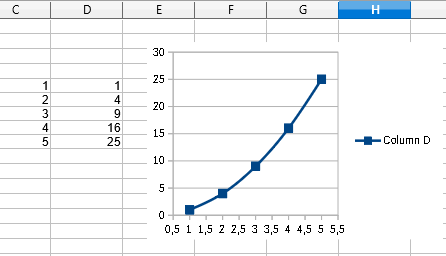
I have plotted some data in Calc, which was initially displaying correctly as a chart. However, the chart is now no longer visible, but is displayed only as a transparent grey bordered box with a small “OLE” document icon at the centre. All the data is still there and can be edited and formatted without a problem (the is correctly displayed during editing!), but as soon as I click away from the chart the boxed icon is again all that is visible. I have searched for a solution online and also looked through all the menu Options for a solution but am unable to find one. This problem occurs on all of my spreadsheets, so it seems to be is global issue. Does any know how to set the charts to display as normal please?
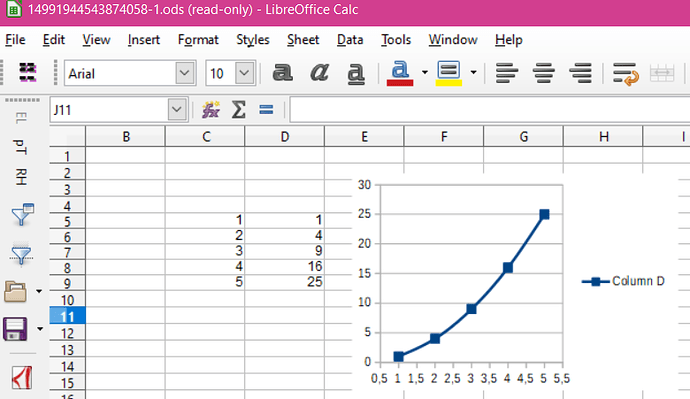
Here is a test file which does exhibit the issue — test.ods - and a screen dump of the chart, as it appears
 …
…


