What is the easiest way to quickly chart a function/equation in Calc?

Hi there.

I would like to visualise as quickly as possible a function in a graph.

Say I have the equation

y = x*4+2

How can I visualise this function quickly in a xy graph without having to create a column of x values and an adjacent y column with the function in the cells and then plot the table?

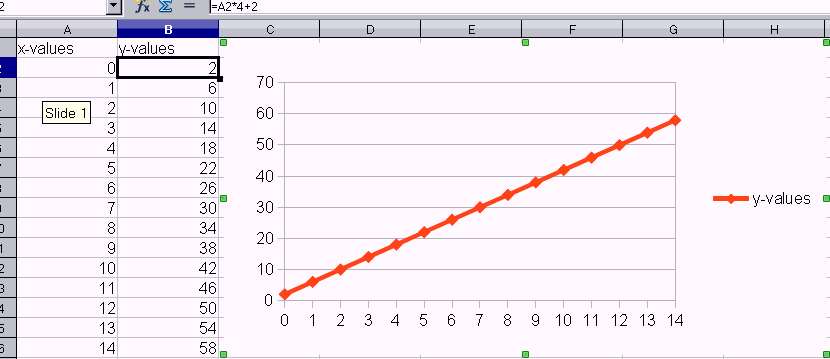
There no easy way in Calc the way you want it. If you need to display a lot of different functions consider a separate program.

For windows XP there are MS Power Toys with a free and good graphic calculator.

Windows 7 has also from MS free Mathematics.

Don’t know anything for Linux :(.

@horst - Thanks for the hint with Power Toys.

Here is the solution. However I strongly recommend to read the Calc manual on topics like formulas and charting.
Writing your question in AskLibO takes you more time than creating the data and the chart.

Thank you for your answer. So the answer is “no”, there is no easier way. I ask this question because I often have to see how a function looks like, and I was wishing Calc was able to graph them just from an equation in a cell. I guess I was overestimating it :slight_smile:

@UbuntuBrisbane - Although I did not test it yet, the hint from @horst should be a solution for you.