Hi there.
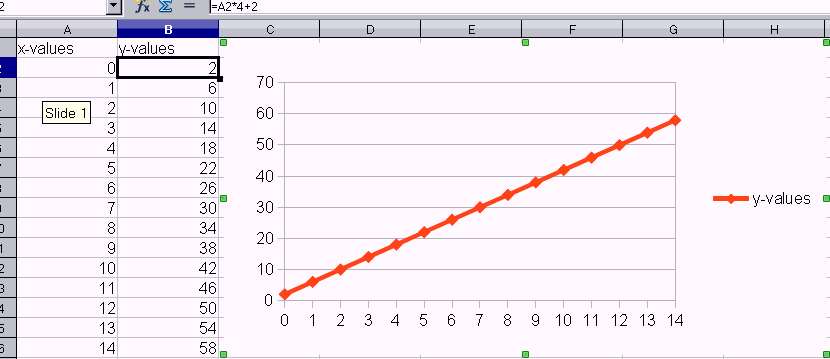
I would like to visualise as quickly as possible a function in a graph.
Say I have the equation
y = x*4+2
How can I visualise this function quickly in a xy graph without having to create a column of x values and an adjacent y column with the function in the cells and then plot the table?


