In a chart, is it possible to remove a series "Name" from the legend while keeping the series plot in the chart?

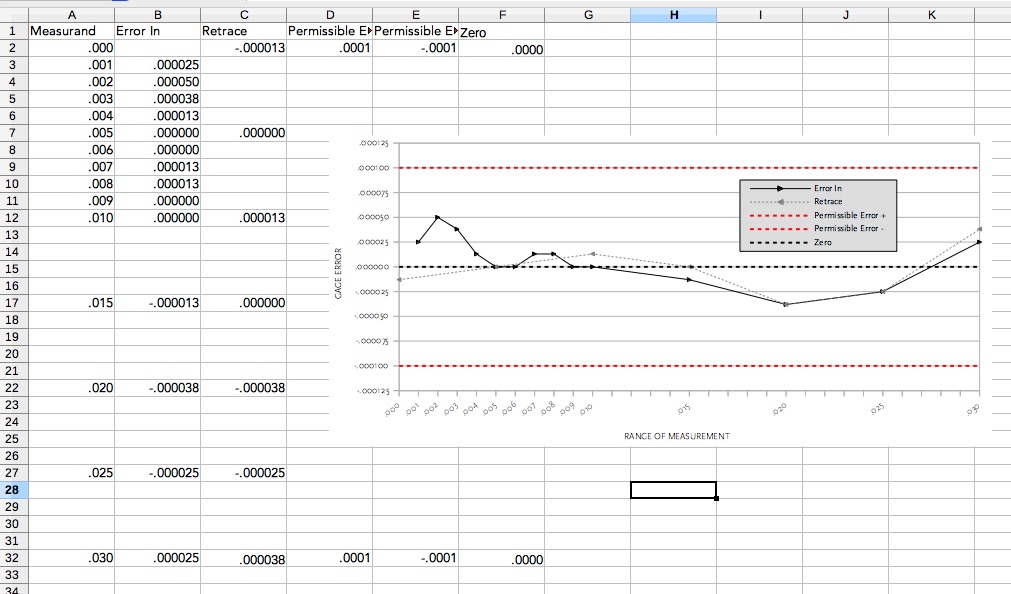
For the purpose of saving space and because that particular series is self-explanatory, I’d like to remove the Name of that series from the legend, but keep its series plot (in this case a straight horizontal line representing zero) in the graph, in my case a Points and Lines chart. Visually, it’s nice to have that zero line as a kind of visual anchor, keeping the more important plotted series line in perspective. But because the visual line itself is so self-explanatory, it would be unnecessary to include it in the legend. Is this possible?

Also, what exactly is a “Category” in a chart? I believe I understand most of what’s going on in the Data Ranges dialog box—which has taken some time to achieve, I can tell you—but I still don’t know what the “Categories” are and what function they serve. In my charts the Catagories are always just a reiteration of the first column data series.

(Edit: activated screenshot -AK)

In any case, it is advisable to study the documentation:
https://documentation.libreoffice.org/en/english-documentation/

Always a great idea—which is why I already read it. If YOU had read it, you’d know my questions are not addressed therein.

If I knew what you know, I could answer more specifically. But you had no indication that you have already read the documentation. A good expert can certainly help you.

No, you wouldn’t have known, but I’m the type of person who always reads the documentation (and searches for relevant questions/answers) before asking a new question. There are a couple questions/answers here that almost touch on the issue, but not quite. In another forum online someone asked virtually the same question, but about Office, and that fix doesn’t work here.

I don’t have a good example to experiment with, but if you only have one series in the legend, it is simple to delete (or add) a legend from the chart. Double-click on the chart to put it in edit mode, right click on the legend and you should get a dialog box with the option to delete it. Some experimentation may be required but this works in v5.4.5.1.

Looks like it’s still impossible in calc.
My use-case is one data series that I’ve divided into 2 data series because wanted to create linear fitting for specific range (not all the data). So actually I have one “mock” data serie that I want to remove from legend.
Finally I’ve moved to gnumeric (only linux), where there is “show in legend” option for every data serie as well as nice option to set “bounderies” for fitted lines.

Answer to the first question (“remove the Name of that series from the legend”):

Edit the chart (double click on it),¹ double click in the chart line,² and in the Options tab, check Hide legend entry, OK. Available by the end of 2018 since version 6.3.

Answer to the second question (“what exactly is a “Category” in a chart”):

Categories are the equivalent to Data labels for XY (Scatter) and Bubble chart types; usually the first column of data that define the horizontal position in the chart.

¹ Also can select the chart, choose menu Edit - Object - Edit.

² Also can secondary click on the chart line and select Format Data Series….

Tested with LibreOffice 6.4.7.2 (x64); OS: Windows 10.0.


Add Answer is reserved for solutions. If you think the answer is not satisfactory, add a comment below, or click edit (below your question) to add more information. Thanks.

Check the mark (Answer markCorrect answer mark) to the left of the answer that solves your question.

If the answer helped you, you can mark the up arrow (Upvote mark) that is on the left (to vote, you need to have karma of at least 5).