
This is heartening! Do we have statistics about the number of posts and the posts-per-user ratio?
@manj_k - thanks to your help I could get the data from start in Feb 2012. I will continue with monthly updates until there is better statistics provided or someone else will take over.
I don’t know what kind of data are available. Data like @CyanCG pointed out would be very interesting. I would volunteer to look into such data if I get access to such data.
Such kind of information could also be published on the meta-page, which was proposed recently.
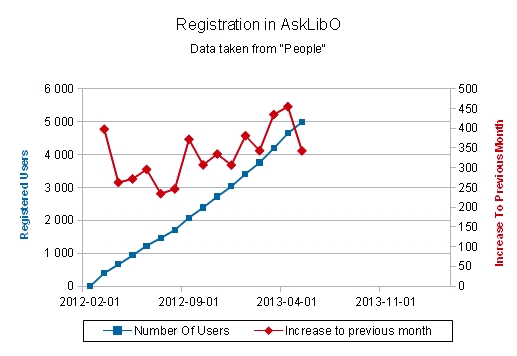
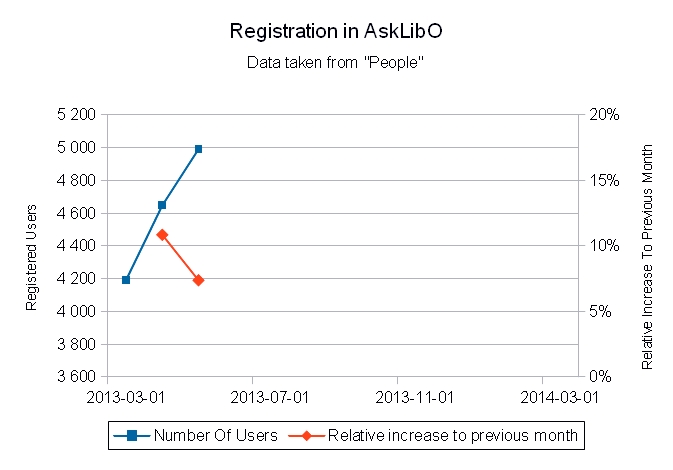
Development since 2012-02-12
Registered	Date
Users #
1		    2012-02-12
1000		2012-05-05 (+83 d)
2000		2012-08-24 (+111 d)
3000		2012-11-27 (+95 d)
4000		2013-02-13 (+78 d)
5000		2013-04-30 (+76 d)
6000@manj_k - Do have above data also the other way round (registered users (date) )? A few (quarterly?) data points would be sufficient. I add them then into my chart.
You may play with “author:xyz” to get the data member since.
E.g.: “author:1480” 
(please copy the complete line)
Click on “ROSt52” in one of the listed contributions – and you’ll get
Profile - ROSt53 - Ask LibreOffice – member since Jul 3 '12 …
Now try to find a member since Jul 1 '12:
Interesting explanations!
Does “author1480” that this member is the 1480th member that registered since the beginning?
If so, playing around gives me additional data points.
Yes, that’s in chronological order.
Perfect, then I can get pretty good data from the time of start of AskLiBO until my data start. A small deviation is not much of a problem as I expect to get a pretty much linear curve
@ROSt53 – Maybe, you could change the title of your initial “question” to
Number of registered users on AskLibO
(or something like that).
@manj_k - Titel change is done. Wiill be visible in the next update beginning of June. I am always open for improvements. “Improvements are a never ending story” is what I am thinking always.
@CyanCG and @manj_k - thanks to reactions.
I have only the data I provided in the chart.
The earlier data of reigistered users
-
can be integrated in my chart
-
I can handover my Calc file to someone else to add old data and continue.
A comparison of number of downloads of LibO and number of registered user could give indications on the usage of the downloaded packages.
Number of posts per user could become an indication on knowledge about LibO and the ease of using it. some other data from bug reports etc would be needed additionally.