What defines a data range?

This may seem like a simple question but I would like a clear definition of a data range.

When I make a chart, I can specify the range of data (such as A5:A27) to be displayed in the chart. I also understand that the data range can include more than one rectangular range of cells.

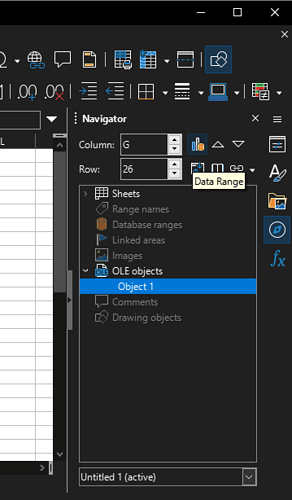
What is less clear to me is what data range means when starting with an individual cell. For example, on the Navigator, there is a Data Range option. Clicking that option selects a rectangle of cells that contain data and that are contiguous with the selected cell.

As far as I can tell, cells outside of the rectangle that link to data inside the rectangle or that contain additional data are sometimes included in the data rangeā€“that is, the rectangle becomes bigger. But sometimes those cells are not included. What determines their inclusion is not clear to me.

Unfortunately, the documentation is not clear enough. It explains that the data range shown with the Navigator is the data range of the selected cell. But that does not define what determines the data range.

So, I would appreciate a definition of data range that clearly spells out what determines which cells are included and which cells are not included.

1 Like

When you start a chart with a single cell selected, the data range is the cell range of adjacent non-empty cells around the selected cell. In other words: a rectangle of content cells surrounded by empty cells. The navigatorā€™s data range button selects the same range which is also known as ā€œcurrent regionā€.
When you start a sort operation or a filter operation from a single cell selection, the same kind of data range is assumed as a list. This is one reason why you should avoid empty rows and empty columns in a cell range that is supposed to be some kind of ā€œtableā€.
This must not be confused with a ā€œdatabase rangeā€ which is a special kind of named range defining a database-like list.

1 Like

I ā€˜thinkā€™ the data range is the total box around the data you want to chart. For a simple chart this includes a box around both the data for the X and Y axes.

Then the trick is to define the ā€œcategoriesā€, which it seems for a simple chart is the X axis values.

Pitty that no one ever answered this years ago, as I have stumbled over this many times, and the documentation on this is really brain dead.

Your reply is completely unrelated to the question asked. Years ago, it referred to Navigatorā€™s ā€œData Rangeā€ (and ā€œnavigatorā€ appeared in the questionā€™s tags). But there was never such an ā€œoptionā€ in Navigator - even in LO 3.3. There was always ā€œRange namesā€ (referring to what now is defined by Sheet|Named Ranges and Expressions), and ā€œDatabase rangesā€ (defined by Data|Define Range), both completely unrelated to chart ranges.

I stand corrected: there is a ā€œData Rangeā€ button in the Navigator:

But most of all, naming something ā€œbrain deadā€, and not even providing a reference to that thing (so that even if you are not willing to invest into improving something you feel needs improvement, then at least others could do) is plain brain dead.

1 Like

Iā€™m sorry Mike but how was an answer about a ā€œchartā€ and the ā€œdata rangeā€ ā€˜completely unrelatedā€™?

And would I be crazy now to say that from your implied definition of ā€˜completelyā€™, that you are also ā€˜completelyā€™ wrong about this?

It seems like I upset you.

How does the calc manual define ā€˜data rangeā€™? What is that definition?

@EasyTrieve I didnā€™t claim it defined it at all (and of course, that it does that properly). I only feel bad when people call something (which may be some work of love, I know how many people in documentation team try hard to improve the state of documentation) ā€œbrain deadā€ - and not mention what was so bad, that they felt it OK to hurt unknown people by calling it so rude. I agree that we have lots to improve - and I even could live with it when you at least point to something specific; but I feel personally injured (even though I myself am not part of documentation team) when someone does that, without even pointing: ā€œyou have bulldroppings in your documentation (and I saw that); but I donā€™t give you a specific help page I saw, go look for it yourself, your losersā€.

Again: the question was about Navigator; and that range is unrelated to Chart ranges. Creating charts initially could use the current region, nothing else.

@ mikekaganski I hear that you feel bad for how the documentation team will hear my comment. Iā€™d say to them, grow up and get over it. Part of their job is to listen openly to some feedback of how frustrated people are with some part of their work.

But this isnā€™t really the right answer, is it? Letā€™s dig deeper:

Somewhere over the last 50 years that Iā€™ve been coding what changed was that the coders stopped writing the documentation and tried to get others to do it, and as this happened the quality of the documentation deteriorated. In my life time because of this I think, there has been a remarkable loss of documentation clarity. These ā€˜documentation teamsā€™ do their best, but because they are less knowledgeable, they often donā€™t really understand the software that well. So they write it up and hope that people can use what theyā€™ve written.

I have long felt that itā€™s the responsibility of the person who creates technology to explain it to others well enough that others can use this new technology.

In this case, there are at least three people who failed to understand the technology that the software authors developed. That would be me, the questioner here catbil, and one or more members of the documentation team. The result of this failure, is that at least the questioner and I, and probably many others, were left to try and figure out the software on their own by guessing, hacking, and asking questions about it. I can tell you first hand how frustrating this process is, and how many unnecessary and wasted hours were spent because it was never clear how to use this chart feature. Honestly, for about the past 10 years or more I just gave up on it as too broken to use.

We donā€™t know what happened to catbill here. She went missing. I think a fair hypothesis would be that she became frustrated and decided not to continue trying to use LO.

So what about fixing this mess? The way to do that I think is to again make the coders write the documentation. You might disagree, but that is my firm opinion. ā€¦ yes they would have less time for coding. But why code if people canā€™t use what youā€™ve coded because they donā€™t understand how to use it?

1 Like

Same with UX design.

@ mikekaganski Thank you Mike for sharing your further thoughts with me. (Note to others: these were done privately). In other words, to be clear, I donā€™t mean to say thank you for sharing them privately, (to me that doesnā€™t matter so much), but simply thank you for sharing your further thoughts with me Mike.