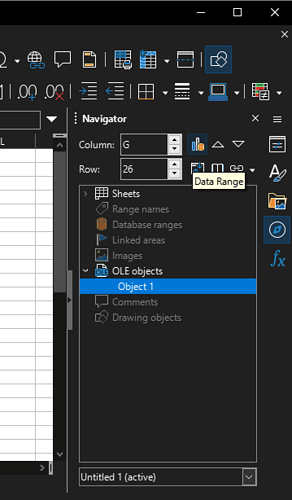
This may seem like a simple question but I would like a clear definition of a data range.
When I make a chart, I can specify the range of data (such as A5:A27) to be displayed in the chart. I also understand that the data range can include more than one rectangular range of cells.
What is less clear to me is what data range means when starting with an individual cell. For example, on the Navigator, there is a Data Range option. Clicking that option selects a rectangle of cells that contain data and that are contiguous with the selected cell.
As far as I can tell, cells outside of the rectangle that link to data inside the rectangle or that contain additional data are sometimes included in the data range–that is, the rectangle becomes bigger. But sometimes those cells are not included. What determines their inclusion is not clear to me.
Unfortunately, the documentation is not clear enough. It explains that the data range shown with the Navigator is the data range of the selected cell. But that does not define what determines the data range.
So, I would appreciate a definition of data range that clearly spells out what determines which cells are included and which cells are not included.

