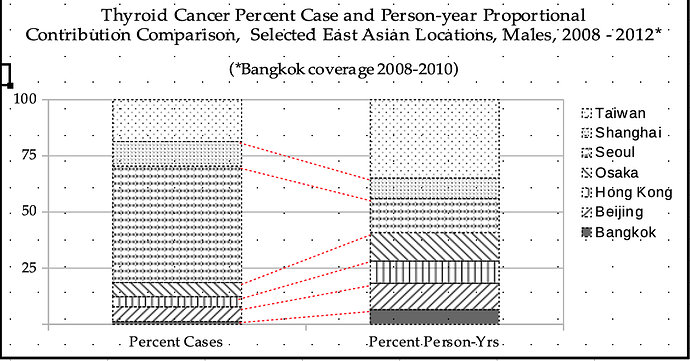
Calc comparative column line chart

LibreOffice:
Version: 6.1.2.1
Build ID: 65905a128db06ba48db947242809d14d3f9a93fe
CPU threads: 4;
OS: Mac OS X 10.14.5;
UI render: default;
Locale: en-US (en_US.UTF-8);
Calc: group threaded

I have occasion to prepare a chart that has the following qualities:

  1. It is a column and line chart.
  2. Each column represents one variable.
  3. Each column is partitioned into sections.
  4. Sections represent one measurement for one category variable.
  5. Sections are stacked in the same order.
  6. A line connects one section in one column to the corresponding section in the next column.
  7. The line represents the end value of one category measurement and the begin value of the succeeding category.
  8. Lines do not cross; they follow the section pattern the stacking order dictates.

Describing this need using 1,000 words is no match for one picture, so one is attached. Connecting lines are drawn in, not embedded. Lines are grouped; they retain relative position to one another when the grouped unit is moved. However, and this is the problem, when the chart is moved or zoomed in / out, the line group does not move or zoom. How would a user go about making the position of the line unit relative to the chart stable? Is embedding the line unit as an OLE object in the chart possible, in lieu of a native capacity to create such charts?

LO Chart documentation is silent regarding this topic. Neither does such appear among questions in this forum.

Thank you for considering this issue.

Jim Martin

Copy your chart and paste it in Draw as GDI format. The disadvantage is: It’s no more a chart and can’t be edited as a chart. But scaling does not disturb any part of the columns, lines, text.

For later editing as a drawing object you may break the GDI end alter every graphic element.

Hello Grantler. The idea you provide is useful. That the ability to update the chart by updating the data in it is lost when the chart becomes a Draw image is not much of a cost. A copy of the original chart can easily be created and updated as necessary. If the product is to appear in a publication, for example, retaining the update function may not be desireable.

Thank you again.

Jim Martin

I would seriously disuade from doing this. Too much effort for too little use.
If you are decisive to do it, use statisticak/graphical software specialised on many kinds of stubborn chart formats.
If you are decisive to do it with LibreOffice, accept some handiwork a specialist in graphics might apply in an important case: Finetune, fineadjust, some helper tables, use tricks like overlaid charts of which the topmost is transparent…

Very long time ago I played with such things for teaching purposes. It didn’t pay, and I ceased it.

See this silly example to get an impression what’s needed. However, you can update (change) some values in the topmost table to see the concept working at its best.

Thank you, Lupp. Your responses to questions are illuminating, and usually point toward a solution if one exists…
I have reviewed the object residing at the link you provide. Having to overlay charts and having precisely to configure the placement of values in data ranges for both images, and having to configure sizes, etc., must be a tedious task, and probably not worth the time.
The two possible solutions in the original question remain: Is it possible, one, to embed an object in a chart, and two, would writing the code to accomplish this be a worthy task?

A solution another participant offered, which is to compose the chart as needed and then to transform it into a Draw image, offers an acceptable balance between a creating a stable image and simple execution.

Thank you again.

Jim Martin

It wasn’t quite as complicated as you seem to asume. The newly created demo file was open for about 40 minutes, and I didn’t work on it all the time.
It needed, however a bit more time than I would accept as an average for demos to get attached to my answers here. (It was a nice challenge reminding me of times when I still did things of the kind wrongly assuming they were useful. In fact the only effect in teaching -my profession- was to guide one or another student to find their interest in software usage. Good or bad?)

Perhaps you have no choice about the type of chart but here is an alternative way to think about presenting the data that would be relatively easy: Make it a line chart with two data series. One data series is Percent Cases and the other is Percent Person-Years. Then make the cities categories.
Might that work for you?

Catbill, Thank you for making the suggestion. I shall attempt to create such a chart. if it conveys the information I seek to convey, and uses capacities native to LibreOffice, others who have the same need stand to benefit as well. Thank you.

Jim martin

I hope my answer worked for you. If it did, please mark it as answered by clicking the checkmark to the left of the answer. That way, other people can readily see that there is a workable solution.