LibreOffice:
Version: 6.1.2.1
Build ID: 65905a128db06ba48db947242809d14d3f9a93fe
CPU threads: 4;
OS: Mac OS X 10.14.5;
UI render: default;
Locale: en-US (en_US.UTF-8);
Calc: group threaded
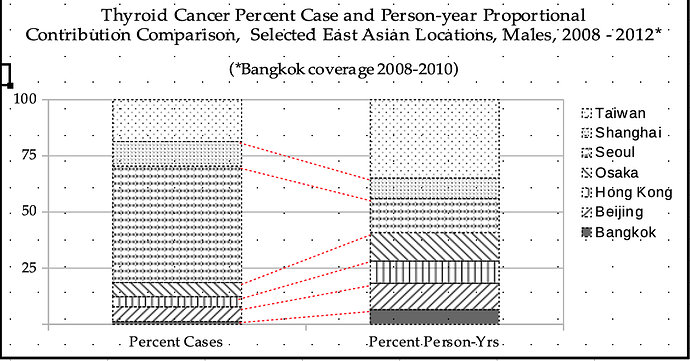
I have occasion to prepare a chart that has the following qualities:
- It is a column and line chart.
- Each column represents one variable.
- Each column is partitioned into sections.
- Sections represent one measurement for one category variable.
- Sections are stacked in the same order.
- A line connects one section in one column to the corresponding section in the next column.
- The line represents the end value of one category measurement and the begin value of the succeeding category.
- Lines do not cross; they follow the section pattern the stacking order dictates.
Describing this need using 1,000 words is no match for one picture, so one is attached. Connecting lines are drawn in, not embedded. Lines are grouped; they retain relative position to one another when the grouped unit is moved. However, and this is the problem, when the chart is moved or zoomed in / out, the line group does not move or zoom. How would a user go about making the position of the line unit relative to the chart stable? Is embedding the line unit as an OLE object in the chart possible, in lieu of a native capacity to create such charts?
LO Chart documentation is silent regarding this topic. Neither does such appear among questions in this forum.
Thank you for considering this issue.
Jim Martin

