Calc - Pivot Table - arrange columnar data from multiple rows into one row

Newbie with Pivot tables
I have a spreadsheet with multiple rows per event and I would like to create a worksheet with one row per event with the values from cells in one column combined into one (or multiple) columns. If I can get a result with one row per event and multiple cells I can concatenate them into a single cell.
My data looks like:

  1. Row 1: Event 1 | Event type 1
  2. Row 2: Event 1 | Event type 2
  3. Row 3: Event 1 | Event type 3
  4. Row 4: Event 2 | Event type 1
  5. Row 5: Event 2 | Event type 2

The number of types per event will vary from 1 to 8.

I would like have a result worksheet like:

  1. Row 1: Event 1 | Event type 1 | Event type 2 | Event type 3
  2. Row 2: Event 2 | Event type 1 | Event type 2 | null/empty

I have guessed that the way to accomplish this is with a Pivot table, but with all my trials and errors, I am unable to get the desired result.
I either end up with multiple rows in the resulting spreadsheet, one line per event type or Event type is missing.
Q1: Are Pivot tables the answer to my dilemma? /n

Q2: Can you point me to a tutorial/previous answer that will explain in detail how to accomplish this.

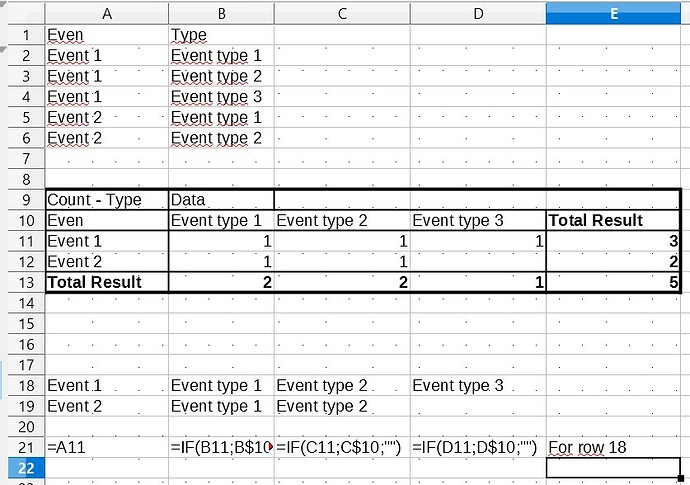
I think pivot table not directly the solution but an intermediate step.

SampleCombinateInRow.ods

This is an old thread, but I was looking for good pivot table tutorials as well.

The best basic resources I was able to find for getting up and running were

“'Pivot Table - Libre Office Calc Tutorial” - YouTube

and

Excel Pivot Tables EXPLAINED in 10 Minutes (Productivity tips included!) - YouTube

The LibreOffice Calc Guides are dry as dust (to me, an example why pivot tables are so difficult : ) but give comprehensive explanations once you understand the basics.

There was a very extensive series of Excel tips (literally in the hundreds) on YouTube that I can no longer find that had a good summary of pivot tables.

The tutorial recommended visualizing your table in advance. This didn’t help at the time because I just couldn’t envisage the data very well. But now I’m working on a complex data set and have to find a way to avoid hours of formula writing.

The first video I mentioned did an excellent job of covering the bases and demonstrating that anything can go into the pivot table editor (whether the result makes sense or not). It was enough for me to tackle your question.

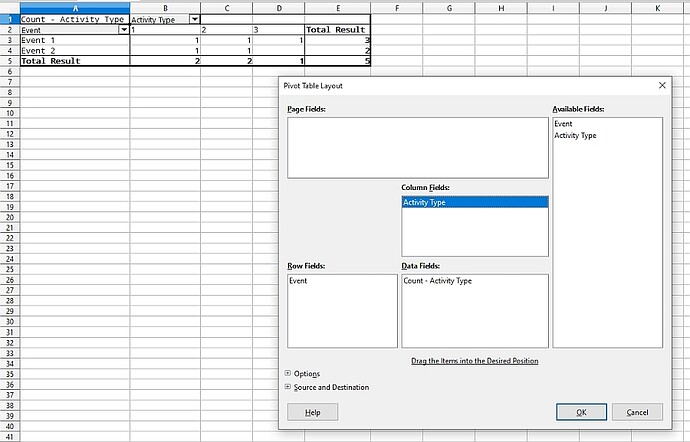
What’s helping me get a grip on the concept is to phrase the problem. Using your (modified) source table:

A Count (Data Fields)
OF

Activity Types (Columns)
BY

Event (Rows)

I used “Activity Type” instead of “Event Type” because it made it easier for me to visualize.

Another resource–like the first video–points out the rows and column fields are interchangeable, depending on what you’re emphasizing

“LibreOffice Calc: Creating Pivot Tables” - Ahuka Communications

Hope this is helpful.