Calc chart x-axis labels truncated

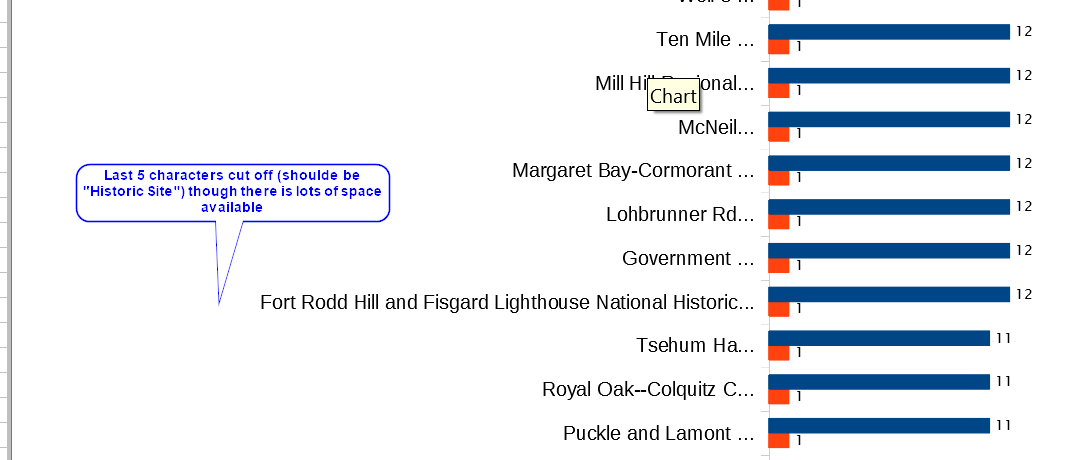
I have a Calc bar chart with long labels for the x-axis. Even though there is plenty of space between the chart wall and the axis to show even the longest label, the label text is truncated.

I can’t find any way make it show the whole label. If I drag the chart area smaller, the label just moves over and is still truncated. Even using a tiny font doesn’t work; the labels are tiny and still cut off. On the spreadsheet the column containing the labels is wide enough to show the whole label (if that matters).

Is there any way to keep the labels from being truncated?

Update 2019-10-06: I found that if I add 4 spaces at the end of the text, then a non-space character, all of the label is visible, though the ellipsis (…) is still displayed. If I just add 5 spaces, it does the same but the spaces tend to mysteriously disappear; the non-space character at the end prevents that. The extra spaces and the non-space character are not shown on the chart, since the last 5 characters are still cut off. It’s not an elegant work around, but better than nothing. I would still like a better solution.

2019-10-07: I have now added the spreadsheet file, with a reduced set of data. I noticed while I was resizing the chart to make it readable on a smaller screen that the number of characters cut off the label changed. No amount of resizing after that would return it to the 5 character cut off, or eliminate the cut off part.

TruncatedChart.ods

I think you will have to give us an example file (.ods) to play with, instead of just a screen shot of the symptom.

This might or might not answer your question. You didn’t tell us which version of LO you are using. It is possible that your version is either too old, or that it is too “fresh” and that you have discovered a bug (not uncommon in fresh versions).

I created this chart using v6.2.6.2 without doing anything special which does accommodate the long names :

15704704151087216-testchart.png

I was using Version: 6.2.7.1 (x64), Build ID: 23edc44b61b830b7d749943e020e96f5a7df63bf.

Maybe it is a bug? Your example is what I would like mine to look like, but I can’t get it to work. There is “nothing special” about how I created the chart, either.

I did notice that as I was creating the chart, the labels were truncated on the right because the physical space was limited. Once the chart was created and placed, I then entered Edit mode to expand the horizontal width, and the labels grew to fill the space they required. The behaviour was as expected so I gained no insight to your problem. :frowning:

David, since it apparently worked alright for me, have you tried to create the chart again, on the theory that something unintended happened the first time??

I started a new spreadsheet, copied the data from the old spreadsheet, created a new chart, and… magic! No more truncated labels. Something must have gotten messed up in the original spreadsheet file, though I don’t know what. I saved the broken spreadsheet as XML and had a look at it in a text editor, and I couldn’t see anything obviously wrong. I suspect some style definition got corrupted.

Anyway, thanks for the suggestion, ve3oat.

Glad to hear that it worked. It should also be possible to simply delete a chart and create a new one in the same spreadsheet. (Did it myself many times when starting to use LO.)

Copying the data to a new, empty spreadsheet and re-creating the chart fixed the problem. I don’t know what went wrong with the original chart; some format setting probably got messed up.