How to create Libre Calc line chart without symbols?

Libre Calc 5.3.6.1, running in Centos.
I created an application to create waveforms and need to plot the data, in CSV format. The data is imported and charted, but the lines are a bunch overlapped symbols. The details are obscured.
What are the steps to get the lines drawn without any type of symbol. I don’t want little square, or triangles, or circles, or anything but just a line. Maybe only one or a few pixels wide.

Thank you for your time.

Hello;

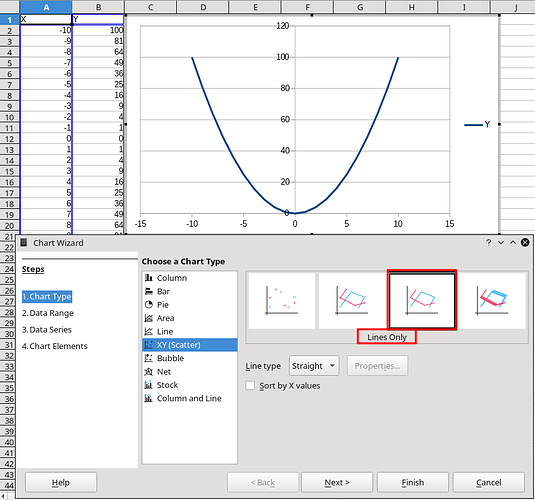
Method 1 Check Lines Only on creation

Note(s): This can also be changed by

  • Select chart
  • Right click -> Chart Type

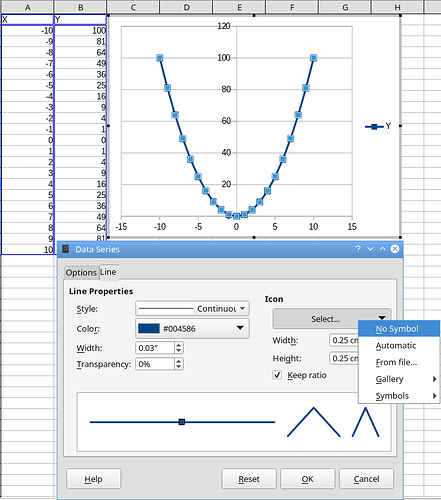
Method 2 Format Data Series

  • Select you data series (click on a symbol of the data)
  • Right click -> Format Data Series -> Tab: Line -> Dropdown: Icon -> Option No Symbol
  • Click OK

Hope that helps.

If the answer helped to solve your problem, please click the check mark (:heavy_check_mark:) next to the answer.

Ok, I found it now. Thanks for the guidance.

Please do not use Add Answer if you actually don’t answer a question but commenting an answer. Please use add a comment for that purpose. Thanks in advance …