I have a line chart with the letter Z in the center. How can I remove it?

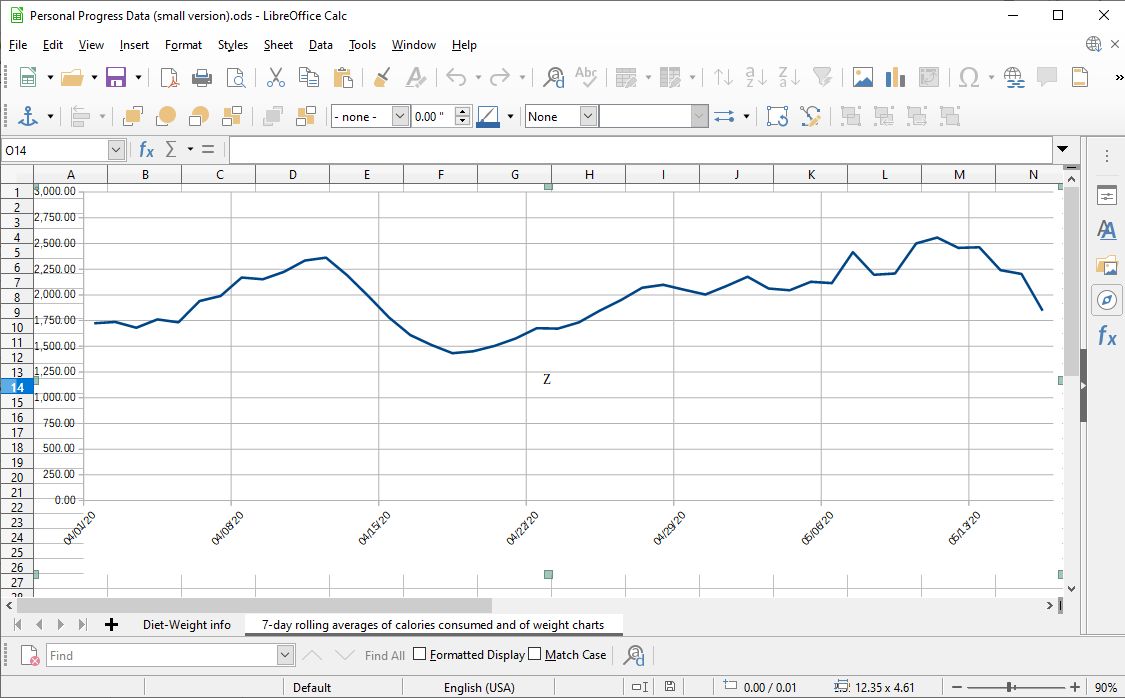
This is a pretty standard 2-axes line chart. For some reason, the letter ‘Z’ is showing in the center. The chart is simply an object in its own worksheet.

I’ve tried checking to see if the ‘Z’ is somehow part of a cell underneath the chart, but it isn’t. I’ve deleted elements of the chart to see if that will delete the ‘Z’. It doesn’t work.

If I double-click the chart to edit it, the ‘Z’ disappears. If I click out of the chart editing, the ‘Z’ reappears.

How do I get rid of the ‘Z’?

I have Windows 10 and LibreOffice 6.3.1.2 (x64)

I uploaded a small version of the spreadsheet. I don’t know how to alter the name of the file in the link below, so I’ll just leave it as is.

I also uploaded a JPG of the chart. It’s a selected chart and as you can see, the ‘Z’ is dead center of the chart. If I resize it, the ‘Z’ just moves to the center of the newly sized chart.

Thanks

C:\fakepath\Personal Progress Data (small version).ods

JPG:

Upload a sample file. OS and LO version?

Cross-linking: Mysterious number "10" appears in centre of calc chart

This might be not a malfunction. The text over the object is similar to what you get when you create a rectangle, insert an image, etc, then select the object and start typing. And of course, when you later select the same object and start typing again, you edit the text you entered previously.

Select the chart; type any character to enter the edit mode; then backspace to remove all text.

InsertTextBox and FormatObjectText (both when the chart is selected) are relevant for this functionality.

Possibly worth filing a report if that’s an unwanted behaviour … no idea why and when it appeared first, but at least it is ~consistent with other insertable objects.

Additionally to your approach I discovered 5 OLE objects in the file (Navigator), only one of them (Object 2) seems to be the chart. There might be some residues from some other proceedings… So it seems that the file has to be “cleaned” or built up from anew…

Grantler,

You are right about the OLE objects. I had four hidden worksheets that I totally forgot about. Each hidden worksheet had one chart (OLE).

Mike,

I checked to see if there were textboxes that I somehow overlooked, but I couldn’t find any. It seems to be a glitch, perhaps owing to my updating the program to the latest version. That’s the only thing I’ve done differently.

Thanks.

There’s no “textboxes that you overlooked”, there’s my explanation that you have overlooked; and you obviously didn’t try to do what I suggested.

The chart itself is the textbox.

@dma10014

Yes, it seems to be a malfunction of LibreOffice.

I opened your file on OpenOffice 4.1.7, the Z disappeared. Then I saved without changes (save as) and opened again on LibreOffice: The Z did not appear any more.

Probably your user profile is slightly corrupted? Try out to generate a new one. See LibreOffice user profile - The Document Foundation Wiki

ZInBackground_OO.ods

PS: Probably a XY scatter chart would better do. If you missed some data it could prolong the line graph in a better way…

I tried using OpenOffice to open and save the file and it worked. The ‘z’ was removed, although Open-O seemed to delete a trendline I had inserted. I just reentered the trendline.

It’s something weird with LibreOffice, since it worked correctly with Open-O.

Thanks for your help.