How to create a stacked column chart with two Y axes?

I have the following progressive electricity tariff (the more you consume - the more expensive it gets per each unit):

  1. first 10 kW⋅h per month - $3 per kW⋅h,
  2. next 20 kW⋅h during month (up to 30 total) - $5 per kW⋅h,
  3. everything over 30 kW⋅h per month - $7 per each kW⋅h.

(real numbers differ, this is just an example)

I’ve drawn two stacked charts:

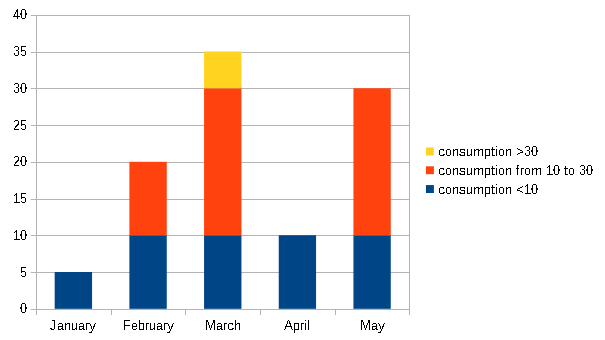
  1. one for consumption, kW⋅h per each month
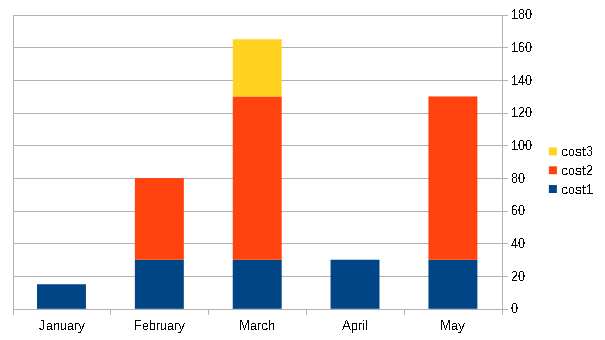
  2. other - for cost, $ per month

image description

Consumption is stacked and consists of three parts:

  1. x <= 10,
  2. 10 < x <= 30,
  3. 30 < x.

image description

Same with cost -

  1. cost of first 10 units,
  2. cost of next 20 units,
  3. cost of other units over 30 kW⋅h/month (if any).

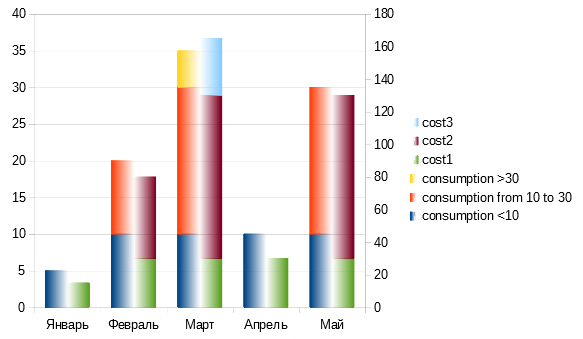
How do I combine these charts into one, with two Y axes? I want that each month has two stacked columns: one for consumption, and one for cost. Is it possible with LibreOffice Calc?

I attach sample data sheet for you to be able to easily play with it.tariff-sample.ods

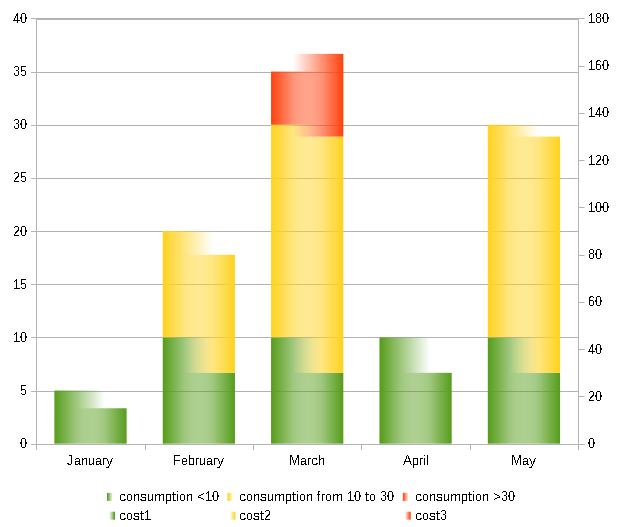
It seems it does almost the correct thing - it stacks only series that are bound to the same Y axis. But unfortunately it places the bars in front of each other, so one hides the other. Here is your sample with such a chart, where I played with series’ areas, making them transparent with hand-adjusted gradients, so that the chart is almost usable (but you still can’t mouse-select the series that is actually overlapped by a (transparent) other series)…

image description

I’d advise to file a bug report.

tdf#133988

Thank you @mikekaganski for you suggestion!

This is not perfect, but it works however! The result is quite illustrative, IMO.

Here’s what I’ve finally got:

For consumption column I’ve set the following in the Format Data Series dialog, on Transparency tab:

  • mode: gradient
  • angle: 90°
  • border: 30%
  • start value: 100%
  • end value: 0%

For cost column - all the same, except for:

  • angle: 270°

I attach the resulting sheet: 15921506065381837.ods