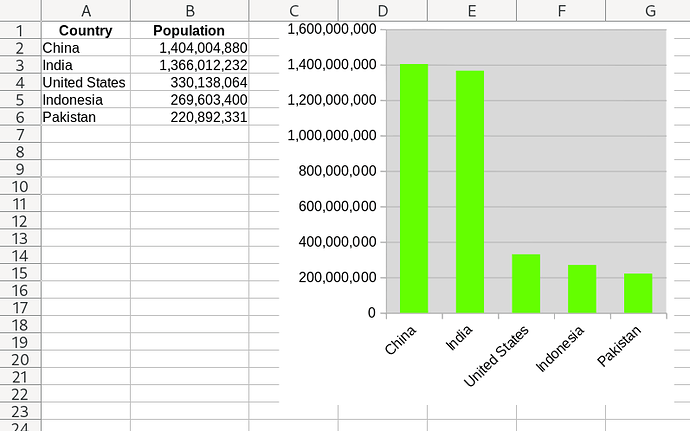
Use macro to set/change chart column color based on a variable

hi.

i have many new charts to create on many worksheets (some sheets contain several charts) of different sizes every day.

i want to use a macro for that.

i can create column charts successfully using a macro; so that is good.
in this case each chart is comprised of single columns (the value on a specific date) for a value over time (stock price) - about 500 columns.

the columns are the same color (blue) on all the charts (as expected) on all the sheets.

Question:
is it possible to ‘set/change’ all the columns color for a specific chart on a specific sheet based on a variable via a macro? either at chart creation time, or after the chart is created.

for example:

if the variable is ‘1111’ for ‘sheeta’ the columns are all set to the color orange.
if the variable is ‘2222’ for ‘sheetb’ the columns are all set to the color green.

etc.

thanks

Replace COLOR for color you want

sub main()
dim mRangos(0)
dim rec as new com.sun.star.awt.Rectangle

	COLOR = RGB(100,255,0)

	doc = ThisComponent
	sheet = doc.CurrentController.ActiveSheet
	
	cell = sheet.getCellRangeByName("A1")
	address = get_range_address(cell)
		
	chart_name = "MyGraph1"
	
    with rec
        .X = 6000           
        .Y = 0            
        .Width = 10000    
        .Height = 10000   
    end with

    mRangos(0) = address
    charts = sheet.charts
     
    if charts.hasByName(chart_name) then
	    MsgBox "Chart exists"
    	exit sub    
	end if
	
	charts.addNewByName(chart_name, rec, mRangos, True, True)	
	chart = charts.getByName(chart_name).EmbeddedObject
	
	data = chart.Diagram.getDataRowProperties(0)
	with data
    	.FillBackground = True
        .FillStyle = 1
        .FillColor = COLOR
    end with
	
end sub

function get_range_address(cell)
    cursor = cell.Spreadsheet.createCursorByRange(cell)
    cursor.collapseToCurrentRegion()
    get_range_address = cursor.RangeAddress
end function

If prefer Python like me:

def main():
    from com.sun.star.awt import Rectangle

    RED = 100
    GREEN = 255
    BLUE = 0
    COLOR = (RED << 16) + (GREEN << 8) + BLUE

    doc = XSCRIPTCONTEXT.getDocument()
    sheet = doc.CurrentController.ActiveSheet
    charts = sheet.Charts
    cell = sheet['A1']

    cursor = sheet.createCursorByRange(cell)
    cursor.collapseToCurrentRegion()
    ranges = (cursor.RangeAddress,)

    chart_name = "MyGraph1"

    rec = Rectangle()
    rec.X = 6000
    rec.Y = 0
    rec.Width = 10000
    rec.Height = 10000

    if charts.hasByName(chart_name):
        return

    charts.addNewByName(chart_name, rec, ranges, True, True)

    chart = charts[chart_name].EmbeddedObject
    data = chart.Diagram.getDataRowProperties(0)
    data.FillBackground = True
    data.FillStyle = 1
    data.FillColor = COLOR

    return

that did it; i used the basic version. many thanks.