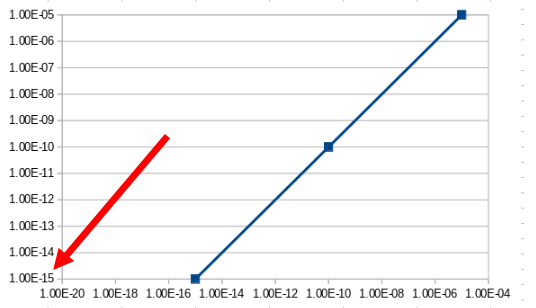
Suppose a simple example. A range of numbers from 1e-20 to 1e-5 on both axes.
Calc will plot these correctly using log scales.
However, if I want to modify, e.g., the minimum value on the y-axis to 1e-15 it will not accept the value but takes it to be zero.
It seems any number less than 1e-10 is taken to be zero.
Using V6.4 but found same issue with V7.0.Test_axes.ods
(Ubuntu 18.04)

