How do I assign data labels to points on a scatter chart?

The X values are in B1:10, the Y values in C1:10, and the label text in A1:10. In Data Ranges > Data Series, the “X-Values”, “Y-Values”, and “Data labels” are set correspondingly. But when I right-click on the series and choose Insert Data Labels, it inserts the Y values instead of the text from A1:10.

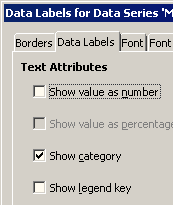
The documentation here for v7.0 says to right-click on the data series and choose Format Data Labels, then go to the “Data Point” or “Data Series” tab. But when I do that, there is no Data Point or Data Series tab (just Borders, Data Labels, Font, and Font Effects, and none of these appears to have any relevant options).

I am using LibreOffice 6.4.6.2 on Ubuntu 20.04.1. Thanks.

Edit the chart (double click on it),¹ click in a chart line and choose menu Insert - Data Labels… - Data Labels tab, uncheck Show value as number and check Show category.

image description

¹ Also can select the chart, choose menu Edit - Object - Edit.

Tested with LibreOffice 6.4.7.2 (x86); OS: Windows 6.1.


Add Answer is reserved for solutions. If you think the answer is not satisfactory, add a comment below, or click edit (below your question) to add more information. Thanks.

Check the mark (Answer markCorrect answer mark) to the left of the answer that solves your question.

If the answer helped you, you can mark the up arrow (Upvote mark) that is on the left (to vote, you need to have karma of at least 5).

Perfect. Thank you!

You’re welcome!