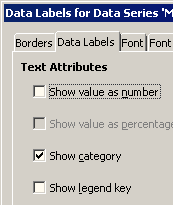
The X values are in B1:10, the Y values in C1:10, and the label text in A1:10. In Data Ranges > Data Series, the “X-Values”, “Y-Values”, and “Data labels” are set correspondingly. But when I right-click on the series and choose Insert Data Labels, it inserts the Y values instead of the text from A1:10.
The documentation here for v7.0 says to right-click on the data series and choose Format Data Labels, then go to the “Data Point” or “Data Series” tab. But when I do that, there is no Data Point or Data Series tab (just Borders, Data Labels, Font, and Font Effects, and none of these appears to have any relevant options).
I am using LibreOffice 6.4.6.2 on Ubuntu 20.04.1. Thanks.

