Gantt type spreadsheet

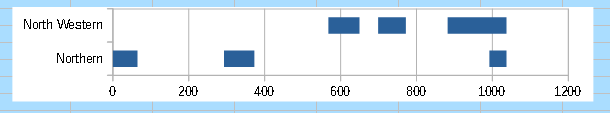
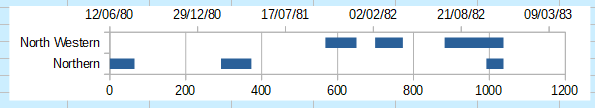
I want to create a Spreadsheet that displays a series of start dates, end dates and durations as a number of bars running across the chart on a time x axis. The y axis would be a series of organisations. The organisations start and stop irregularly up to 30 times over the period and I would want all of these shown on one row for each organisation.
This row could be a summary of whole data series of individual rows with just one start date/end date/duration set of data.

Normally a Gantt chart would display each start date/end date/duration bar on one line but I want to get a number of bars on the same line, so although this looks like a Gantt chart and in many ways is very similar, it is quite different.

I have a sample that I have drawn up showing a few rows of data and a mock up of the chart.Gantt type chart.ods

An idea as a start point: use stacked bars, and add stop periods with no color.

image description

Gantt type.ods

I understand what you are doing here. You are not using the DATE columns to create the chart, instead the spreadsheet is using the DATES to calculate INTERVALS which are NUMBERS and then just showing these numbers on the graph. In order to do this I highlight the entire spreadsheet data area and then remove the DATE columns, leaving the interval numbers displayed.
That is a good aproach and would work with any number of columns. Easy to set up from an existing data set as all you would need to do with a data set of 30 rows (ie. organisations) would be to add columns and then fill the columns with the formula to calculate the difference between one end dat and the next start date.
The only thing we lose is the date information along the x axis which is now expressed as the number of days since the start ie. D-Day. However it would be relatively easy to calculate what D+600 meant in date terms.

Use stacked bars, and add stop periods with no color. To get the date, add a secondary Y axis, set the minimum to the minor date and the maximum to the older date, and select an adequate date format.

image description

image description

image description

Gantt type.ods

Tested with LibreOffice 6.4.7.2/7.0.4.2/7.1.0.3 (x86); OS: Windows 6.1.


Add Answer is reserved for solutions. If you think the answer is not satisfactory, add a comment below, or click edit (below your question) to add more information. Thanks.

Check the mark (Answer markCorrect answer mark) to the left of the answer that solves your question.

Excellent, this will portray all the data in the way that I want it, just got to do it with 350 rows of data! Thank you so much for all your help, I had wasted an entire day trying to achieve the same thing and getting no where.