Single chart with multiple types (eg lines and columns) possible in Calc?

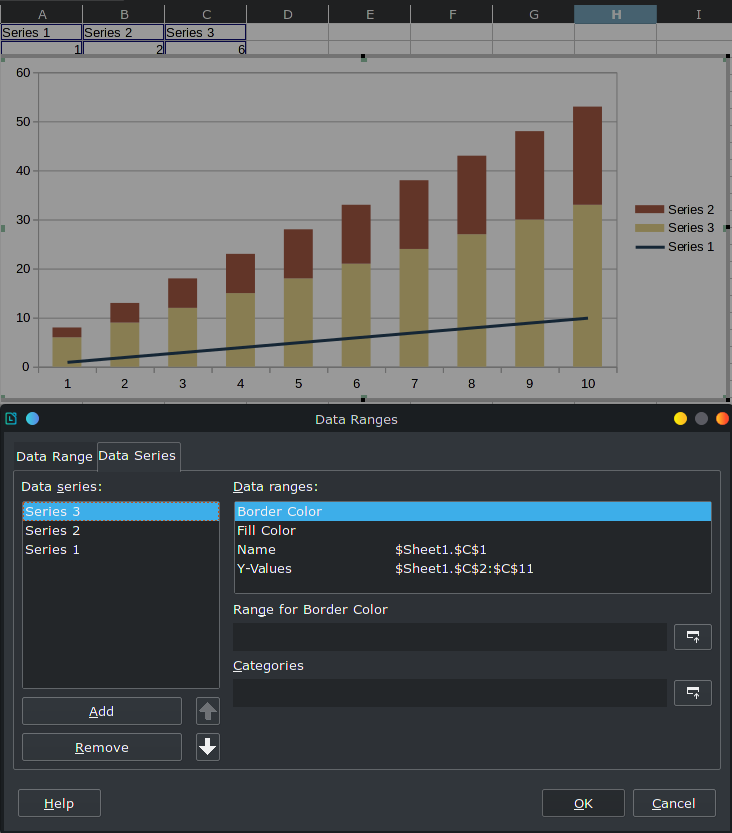
I created a chart with three series in columns. I would like to change two of them to stacked bars and the third to line. Not found a way to do so. Came from years of Excel in which this is very straight forward. Is this possible in Calc? I did try to look through documentation and searched online under “combination chart types” and “mixed line column chart” but am still stuck. Thanks for your help.

If this is possible, I would also appreciate pointers to how to accomplish this in a macro.

Hello,

  • Select your 3 data series
  • Insert -> Chart
  • Select Column and Line in Choose a Chart Type
  • Click second icon Stacked Columns and Lines
  • Click button Finish

image description

Hope that helps.

Thanks. I must be blind not seeing that last option.

Is there a way to change the line to column and vice versa after making the chart?

Yes - use Right click -> Data Ranges and the Up and Down arrows to reorder the data series and use Right click -> Chart Type to redo the chart type definition and you may get something like:


The last entry in the **Data Series:** pane seems to constitute the "line".

thank you so much