How to set cells background gray level based to cells value

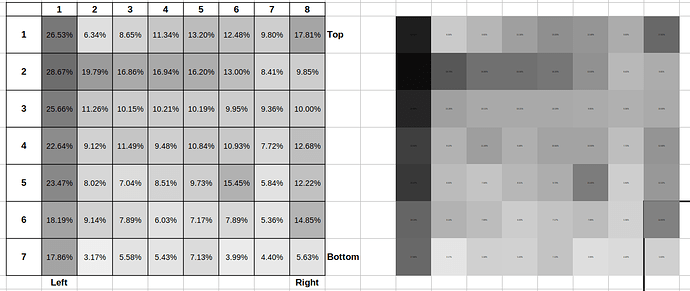
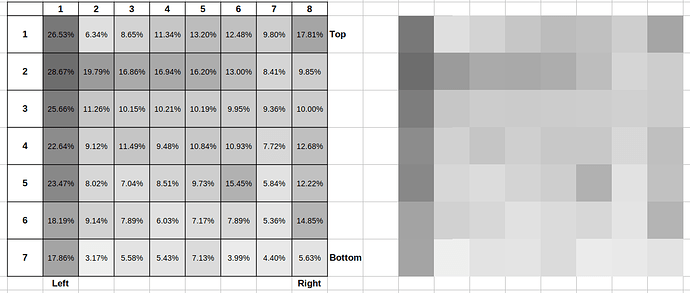
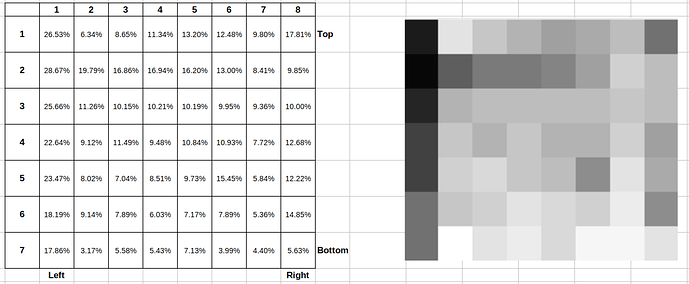
So that if cells value is 100% it would be black and if value is 0% it would be white and between these
the cells background color would be in grayscale based to cells value.

The left side is the numbers (in %) and the right side image shows how each cells background should look like.


Is it possible also to remove the number visibility from the cell (what I tried is to use minimal font size on the right side image)?


It looks this case solution is to use number format ‘#’ to make the number disappear in the cell.

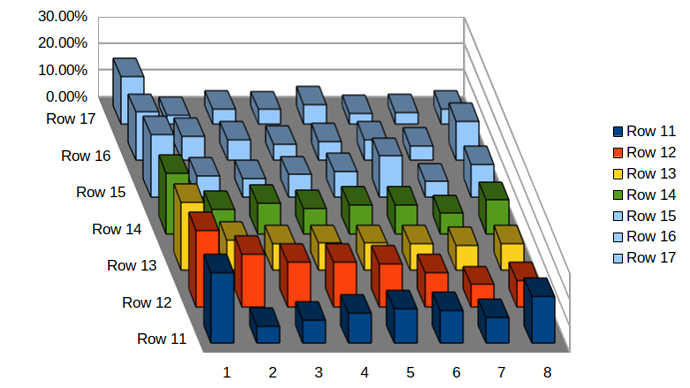
shown with 3D-bar plot:


But could not find yet how to put the ROW11 to the back and ROW17 to the front (like flip the axis).
And if its possible to change the bar color according to the height with gray level.


It looks like the Data Series should be ‘rearranged’ manually by using the / arrows in the “Data Ranges”.
But I suggest flipping the axis functionality (for example if there is more cases (rows), etc it could be more easy to use).

Hello,

  • Select the range of cells
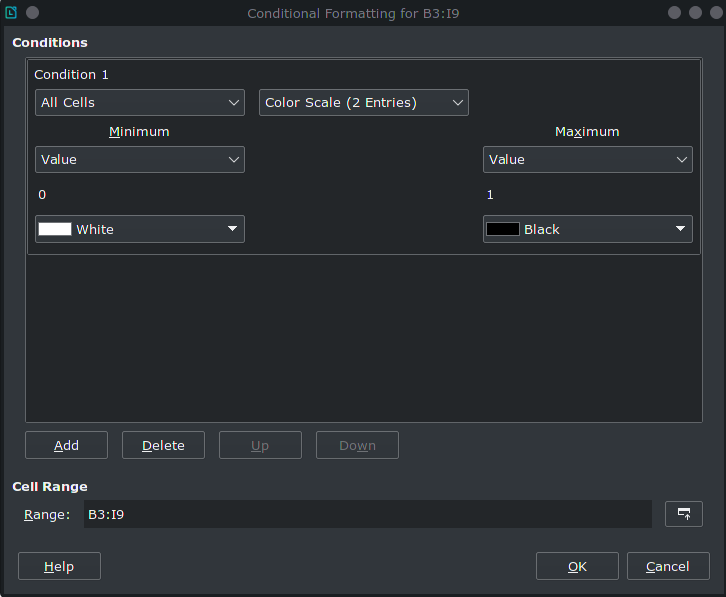
  • Format -> Conditional -> Color Scale...
  • Select All Cells and Color Scale (2 Entries)
  • Select Value in drop down Minimum and set value to 0 and color to White
  • Select Value in drop down Maximum and set value to 1 and color to Black
  • Check that Cell Range covers all you cells
  • Click OK


**Note(s)**
  • The solution works only, if the percentages are real numbers and not of type “Text”.
  • Range B3:I9 is of course specific to my test. You need to adapt accordingly.
  • Playing with Color Scale (3 Entries)-type of condition and selecting some intermediate grey color 0.75 or 0.80 may provide a better result for high values.

Tested using LibreOffice:

Version: 7.1.4.2 / LibreOffice Community
Build ID: a529a4fab45b75fefc5b6226684193eb000654f6
CPU threads: 8; OS: Linux 5.3; UI render: default; VCL: kf5
Locale: en-US (en_US.UTF-8); UI: en-US, Calc: threaded

Hope that helps.

It seems to work, but is hard to be found in manuals and also Google could not find this one. Tks.
But it looks I could not set the font ‘invisible’ and it didn’t save this conditional format if I saved the sheet with xls-format. Using number format ‘#’ seemed to remove the number visibility.

“it didn’t save this conditional format if I saved the sheet with xls-format.”

Do not save it into the obsolete, never standardized .xls file format. Note: There is not (never was and never will be) 100% compatibility between the different file formats. You always will lose some formatting properties when you save your files into foreign file formats. Use the native, international standard ODF file formats.

Conditional Formatting Guide for LibreOffice Calc (Download)


[How to apply a Color Scale Conditional Formatting](https://wiki.documentfoundation.org/Faq/Calc/142)

@jarkky

it didn’t save this conditional format if I saved the sheet with xls-format.

You seem to have joined the club of people assuming that a file format is just a thing of how to store the same information into different formats. And that’s a completely wrong assumption. Storing information in a foreign format requires a translation of functions, features and properties from one document model (LibreOffice in case .odt) into an other application’s document model (i.e. Excel’s document model), which by nature differ from each other. And since Babylon, mankind knows that each translation is imperfect.

In more general words: If .xls does not have such feature, it must be skipped from the export to .xls (which does not mean me knowing that Excel lacks such feature).


You also might be interested in: [[Tutorial] - Differences between Microsoft and AOO/LO files] (https://forum.openoffice.org/en/forum/viewtopic.php?f=71&t=83694)

Continued

… and thanks for completely revising your question after you got an answer to the original question.