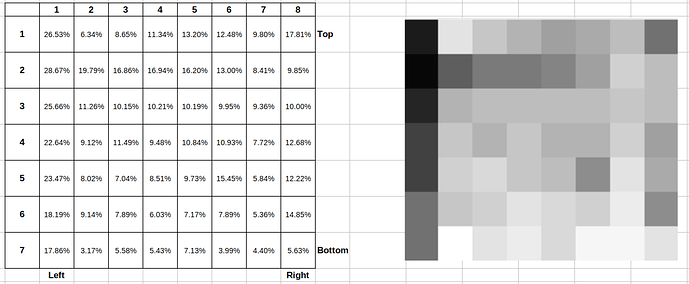
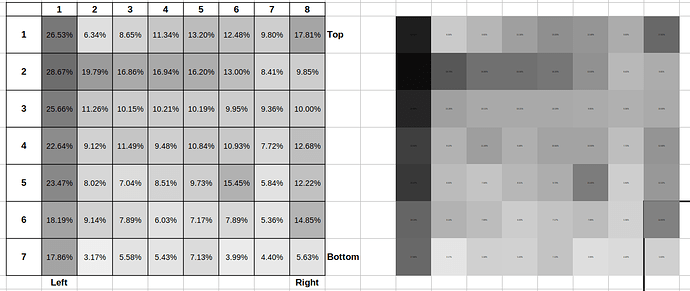
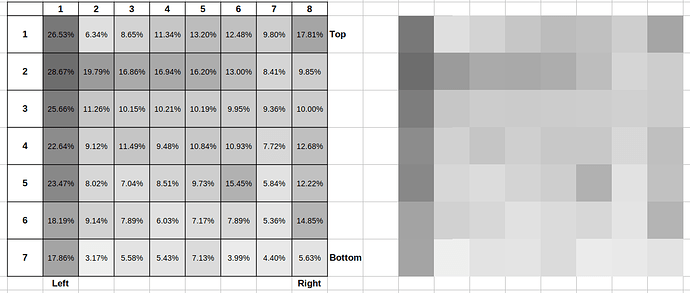
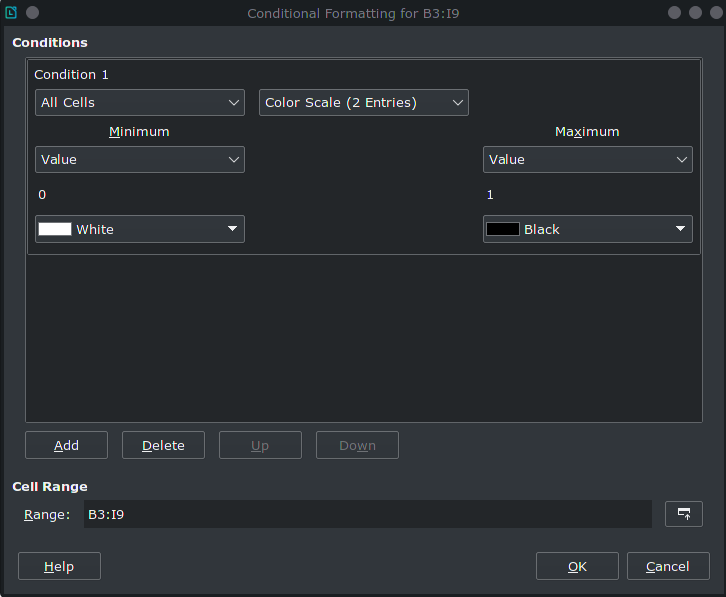
So that if cells value is 100% it would be black and if value is 0% it would be white and between these
the cells background color would be in grayscale based to cells value.
The left side is the numbers (in %) and the right side image shows how each cells background should look like.
Is it possible also to remove the number visibility from the cell (what I tried is to use minimal font size on the right side image)?
It looks this case solution is to use number format ‘#’ to make the number disappear in the cell.
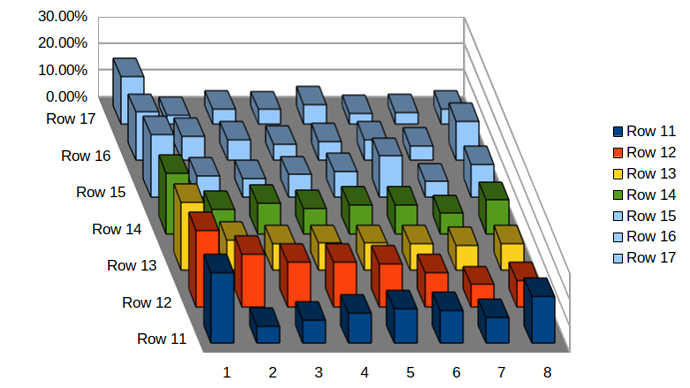
shown with 3D-bar plot:
But could not find yet how to put the ROW11 to the back and ROW17 to the front (like flip the axis).
And if its possible to change the bar color according to the height with gray level.
It looks like the Data Series should be ‘rearranged’ manually by using the / arrows in the “Data Ranges”.
But I suggest flipping the axis functionality (for example if there is more cases (rows), etc it could be more easy to use).

