Why is this bar not working?

Hi, please check this file. The idea is that given a %, a bar will represent the number.
Here is the file (download it to see)

If number is from -25 to 25% = green

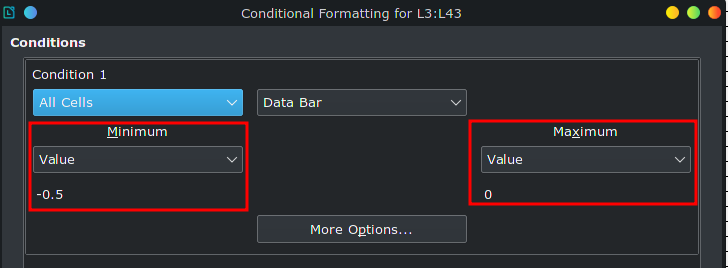
if -50 to 50% = orange

anything past -50 or 50% = red

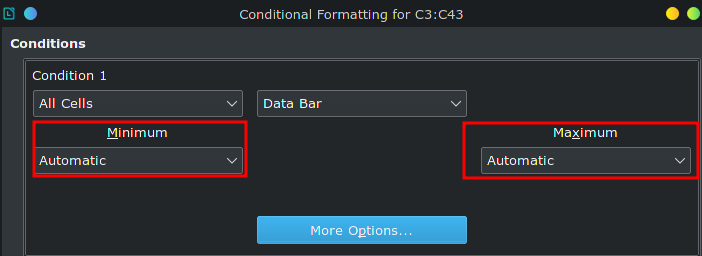
The problem as you can see on the file, is that -55% goes all the way to the left, as if the number was -100% or greater. Why is that?

If I keep testing random numbers, at some point it is a mess. Adding a number changes the bar on another number. I don’t get it. Could someone fix this and send me the .ods and explain what was wrong? cheers

Your question is not related to the AskLO site (how to use it, errors, idiosyncrasies, etc.). So, please, retag to remove ask.libreoffice tag.

If I keep testing random numbers, at some point it is a mess. Adding a number changes the bar on another number.

… because you use “Automatic” for Minimum and Maximum and adding/changing a number recalculates Minimum and Maximum and the definition of which value correspond to 0% (no fill/bar)and 100% (full fill/max bar length) in certain column changes. See also my answer.

Hello,

you seem to misunderstand how an automatic bar works. Your setting of the “Conditional Formatting” (CF) is set to “Automatic” regarding Minimum and Maximum (see screenshot [1] - Original Setting). “Automatic” means

  • the CF is for range C3:C43
  • the algorithm looks for the Minimum value in C3:C43 an set this value to 100% of width of the cell to bar length
  • the algorithm calculates the Maximum value to 0 (or some value near 0) an sets this value to 0% of width of the cell to bar length
  • All other existing values are linearly interpolated between these extreme values

(in your case: -0.05 corresponds to the Minimum and hence is) set to 100% of the column width)

Having said this:

You need to explicitly define the values of Maximum and Minimum to get a proportional bar length. See [2] Modified Setting for Sample File, where I used different Formulas to achieve that each columns corresponds to an interval length of 0.25 and 0.50 (for the sake of simplification of the CFs).

Sample File: DataBar4-Modified.ods
(For the sake of readability, I have changed the format to decimal numbers. Of course you can set back to your preferences).

[1] Original Setting

[2] Modified Setting for Sample File.

Hope that helps

Very nice. It seems to be working fine now. Thanks.
Btw, what does the “Check” column do? it says True on all cells.

It just to SUM() all values calculated by my formulas an compare that with the original data. My formulas split the single value into different columns. Their sum must be the same as the original value. That way I find problems with formulas very quickly (if it would tell FALSE then the formulas won’t be correct). You can delete, of course.