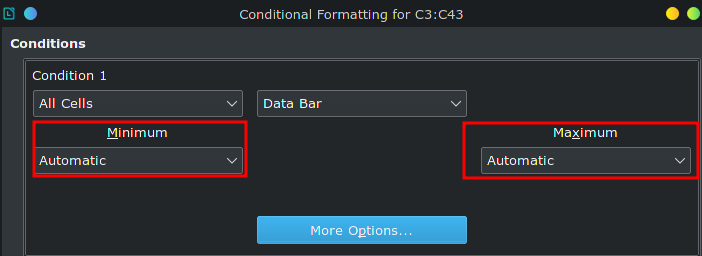
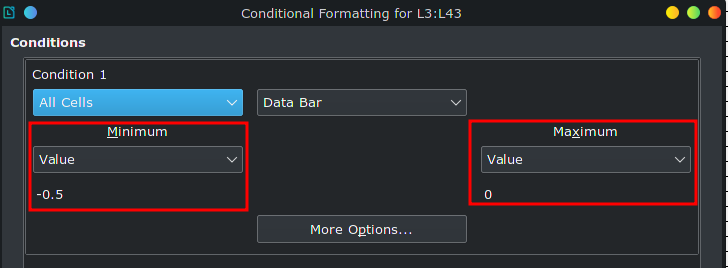
Hi, please check this file. The idea is that given a %, a bar will represent the number.
Here is the file (download it to see)
If number is from -25 to 25% = green
if -50 to 50% = orange
anything past -50 or 50% = red
The problem as you can see on the file, is that -55% goes all the way to the left, as if the number was -100% or greater. Why is that?
If I keep testing random numbers, at some point it is a mess. Adding a number changes the bar on another number. I don’t get it. Could someone fix this and send me the .ods and explain what was wrong? cheers


