Mean Value Line Not Shown on Line Graph

I’ve inserted a Trend Line and a Mean Value Line on an X-Y Scatter graph without a problem. When I create/switch the chart to a Line graph, the Mean Value Line is not shown, although it shows up in the legend and it can be formatted as if it were there.

Is this an anomoly? Is it me? Can anyone duplicate this discrepancy (to confirm or rule out me)?

Windows 7 / LibreOffice 4.3.5.1 and 4.2.6 Portable

Try 4.4.0 Beta 1: http://www.libreoffice.org/download/libreoffice-fresh/?version=4.4.0

Funny you would mention that. When I attempt to edit a chart in 4.4.0 Beta, LO crashes (for now I assume this is because it is under development – not a complaint! Just an observation). That being said, the chart still does not show the mean value line.

No good, at all.

In v 4.3.4.1 on XP I observe no problems

Mean Value Line.ods

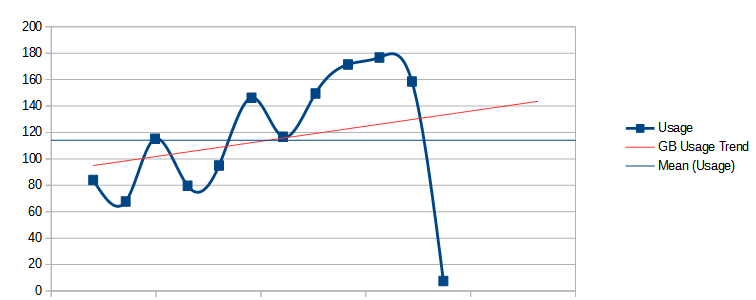
The attached file is set up as a line graph. Column A has 15 Dates; Column B is a set of 12 numbers. The last three dates do not have any numbers in column B. I have set the chart range to be all dates, so the blank numbers are included.

When I delete the last three dates, the mean value line appears when set as a line graph. When I change the chart type to the x-y scatter graph, the mean value line is present regardless of the blank cells.

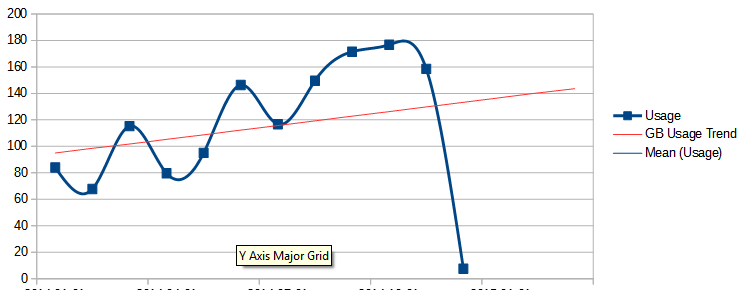
Another observation, when switching the graph from Line to XY, the dates on the x-axis switch from those shown in the data set to apparent random dates.

To answer my own question that yes “this is me”, but cannot confirm if this is an anomoly or expected behaviour (excluding the fact that it is not necessarily the correct way to plot data).