Calc replacing all Chart Data Ranges with Data Tables

I’ve searched on this and seen historical articles talking about this, but Calc is going bonkers for me since I updated to 5.2.5.1 (running on macOS).

Basically, I have pages each containing multiple Charts which are created by setting one up in the format I want, then copying/pasting, and modifying the Data Ranges to point to the correct source table. These charts never leave the current spreadsheet. The document is saved, closed, and opened fairly regularly (as it also doesn’t seem to update all the charts when underlying data changes unless you close and open the document).

Sometime towards the end of today, I notice one of the charts isn’t quite pointing at the correct range, so I go in and try to change it, only to find that the Data Ranges menu option has been replaced by Data Table. I go through my entire spreadsheet to find that almost EVERY SINGLE CHART has had the data range replaced with one of these data tables, and this is not undoable. This isn’t right, I’d checked and double checked all my tables yesterday, and they were all using Data Ranges. (I checked as I’ve had a number of charts suffer this problem earlier in the week). I’ve been working on some of the charts today and they were using Data Ranges. I pull an old version off a backup which proves they were all using Data Ranges, yet even for charts for which neither the source data, nor the charts themselves have changed today, they’ve been altered behind the scenes to use Data Tables.

This is next to useless for me as the source tables are living dynamic things which change on a daily basis. It is no good if the Charts are pointing to a static snapshot of data. There are too many of them and of different types to make recreating them viable.

WHAT THE HELL IS GOING ON?!? I am sorry, but I am losing so much time due to the instability of this version of LibreOffice. I am now going to have to go through and recreate every chart and there are 68 of them!

What on earth is causing this? When is it likely to be fixed as I’m wasting my time right now even trying to do any work in Calc?

In case it is of help, I’ve not been doing anything I consider terribly controversial to my spreadsheet. Recently I’ve been renaming some sheets, before that I added some rows on one of the source tables in order to add an extra data point. Incidentally the last chart I created based on this data point is the only one in the entire spreadsheet that still seems to refer back to a Data Range rather than a Data Table.

The Data Series tab within Data Ranges incidentally is causing me problems too. Whenever I modify a source range, it seems whatever has been parsed out of the original range at creation time and used to create the Data Series entry, partially remembers the old data and affects my new range. I then have to go into Data Series and manually correct the Range for name field (for EVERY data series) and the Data Labels field before it will show the correct data. It would probably work more in the traditional way if Data Series wasn’t automatically saved, unless the user wants customise this as it currently is preventing straight edits on the range. Editing the range on it’s own worked perfectly well in the past.

This is all highly destructive, I can’t believe I’m the only person experiencing these issues right now.

What file format do you use to save?

Standard ODF Spreadsheet .ods

Hi,
I see this post is quite old, but yesterday I’ve had a very similar situation on my laptop running LibO 6.0.6: suddenly, all Calc files it saved in .xlsx format (Office 2007-2013) did lose all the references to their source data and got a data table instead. Very frustrating, since those charts must be updated every day to keep track of a progress in my work.

Quite surprisingly, the problem was not present in another PC in my office, which has the same version of LibO, so I started comparing ALL the settings (Tools → Options) in the two machines.

Everything was identical, except from two options:

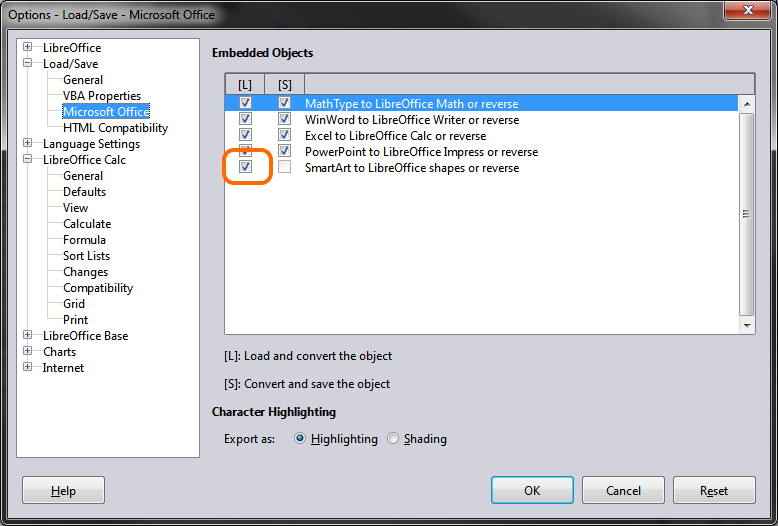
1. Load/Save → Microsoft Office:##

Option of loading "SmartArt to LibreOffice Shapes or reverse was not selected (in the image below, the configuration in the working machine)

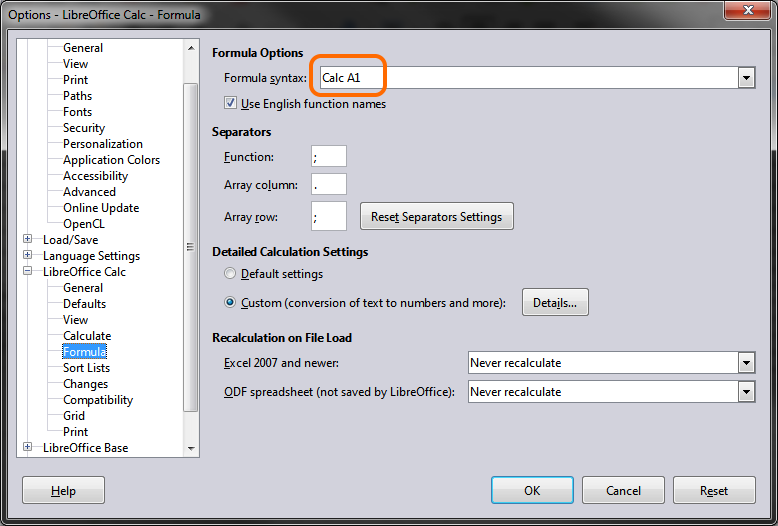
2. LibreOffice Calc → Formula → Formula syntax:##

In my PC it was set to “Excel A1”, while in the other PC it was “Calc A1” (again, the image below shows the configuration in the working PC

After setting the mentioned options also in my PC, I tried saving again the spreadsheet as a .xlsx file… and apparently that did the trick. Now, if I reopen a previously exported .xlsx the charts inside retain their source data ranges.

Hope this can be useful to someone.

Regards,
Max - Italy

Indeed, setting the formula syntax to Excel A1 breaks the chart’s data range references when exporting to .xlsx

That’s a bug, could you please report it? Thanks.

Sure, as soon as i have a little time! :slight_smile:

I’ve reported the bug. Ticket is here: https://bugs.documentfoundation.org/show_bug.cgi?id=121260

Thank you!

I’m looking to revise my question but don’t see a button for that or editing it (is this because I’m a new user? I can flag, close or delete, none of which is what I want to do).

Regardless, some further information on strange behaviour in this spreadsheet which may or may not be related, so may help diagnose the above.

I’ve noted that on my few sheets of source tables, where I have calculations, some of the calculations relevant to the same sheet have had the sheet name filled in in my formula. For all of them. It’s like I have triggered some action and it has decided that action means all formulae must be expanded to include the sheet name. I haven’t been copying these tables from one sheet or to another. All I’ve done is at some point rename the sheets containing the data.

So some action is triggering an action that goes through and does this. I’m beginning to suspect it might be renaming the sheet. But why?!?!

I’ve searched and found this to be similar, but not at all helpful. I’m suspecting either the same or some similar action is triggering the replacement of data ranges with data tables. How is it possible to innoculously do something, yet trigger such massive changes throughout a spreadsheet? This formula thing might seem minor, but makes complex formulae very hard to follow, and the replacing chart data ranges with data tables thing is absolutely catastrophic.

Why didn’t you answer the question by @mariosv first?
Charts are a complicated thing. Even if you copy one from Calc and paste it into a Writer document the data references will be replaced by tables containing the actual data. This cannot be reversed. Same thing may happen if you store to an alien format that doesn’t know about charting in Calc. (I cannot tell from experience because I never do.)

Because the charts were NEVER copied out from their source spreadsheet. For a period of time they were correctly anchored to their data range. I didn’t take any action that should have converted my charts. Honestly I’ve done something innocuous like renaming a sheet, and LibreOffice has decided to go through and expand all local formula references to include the sheet they’re on, and at the same time replacing all Chart Data Ranges with Data Tables. No alien formats or documents involved!

And if you look at the comments you will see I did answer the question by @mariosv first.

@rgl: Sorry! I didn’t recognize your username and misinterpreted the short comment as an advice by someone else.
Sorry again. I do not know further advice. Never experienced that in the way you describe it.
There is an old superficially related bug report tdf#85328 concerning flat ods and recently confirmed to not be fixed. (A short test by myself with V5.3.0 told otherwise confirmed also.)

@rgl: Are you sure that the documents never were save to a different format (flat ods included) in between?

@Lupp Yeah. Unfortunately I’ve had to abandon this. It just isn’t an economic use of my time. I did try to reproduce this earlier on, and found there was no single simple action that reliably reproduced this. So it’s an odd one. I’ve switched to Google Sheets (which last time I tried just wasn’t up to the power of LibreOffice), and I’m finding it much easier all round. It’s actually faster running that over the internet than running the local copy of the spreadsheet on the app running locally!

@rgl: I don’t know GS (except the name), but I used LibO and its predecessors continuously for decades now, and a great deal for critical real-world tasks. There were some flaws and annoying bugs. However, I never actually lost data or functionality to a significant degree - and I never would trust my data to Gxxxxx.
Good luck with your decision for the next 20 years. And now let’s make econmic use of our time again, at least as far as you are concerned. I may continue to waste it.
Regards.

@Lupp: I’ve used StarOffice, OpenOffice and now LibreOffice each as my main spreadsheet, for what I consider fairly complex stuff. Times I’ve been jumping through hoops, but this is the first time it’s went on a spreadsheet wide data mangling drive. Unfortunately I can’t afford to keep recreating things and hoping this time they won’t get mangled as I’ve spent most of the last week seemingly doing that. Thanks for trying. I hope the details I’ve given might help if someone else has this.

This just happened to me with a file I have used for 1.5 year now with many graphics. :frowning: And my file has never been saved to alien formats. It has been an ods from scratch. I had this issue in one or another chart before, but now I just lost all my charts. Disappointing.

I too have this problem. Some charts in a large ods file are converting to Data Table basis. All charts were set up using Data Ranges. I am spending way too much time converting back to Data Ranges.

Web search took me here when the same thing happened to me, so hopefully this will fix it for others as well. It seems that Calc has started to default to saving spreadsheets in Flat ODS format, even when they were opened from ODS files whose existing names end in .ods instead of .fods. Saving spreadsheets in Flat ODS format triggers a bug that breaks charts with cross-sheet references as noted by @Lupp in March 2017.

Using Save As and choosing “ODS Spreadsheet (.ods)” instead of “Flat XML ODS Spreadsheet (.fods)” under “File type” saves a version whose charts are not horribly broken when re-opened, and which as far as I can tell will also subsequently be re-saved in the correct format using plain Save.

I suspect that the last-saved-as filetype is kept internally as a numeric index into a dropdown menu that got some stuff added to it before a recent release, and that Flat XML ODS Spreadsheet now occupies the dropdown menu slot that ODS Spreadsheet used to, but I have no definitive proof of that.

If you’re looking at your .ods files in your OS file browser, you can spot the ones that have accidentally been saved in Flat XML ODS format by their sheer hugeness. A small spreadsheet that would normally fit in under 60KB when genuinely been saved in ODS format bloats to 1.5MB when XMLified; it seems that the Flat XML versions are not compressed in any way, they’re just raw XML text. But the only way making that observation is going to help you avoid your charts getting ruined is if you spot it before closing the spreadsheet you just saved.

Yes, this is pernicious. But it’s also yet another demonstration of why good backup hygiene is an absolute necessity, not merely a nice-to-have or a maybe-to-be-contemplated.