Hello,
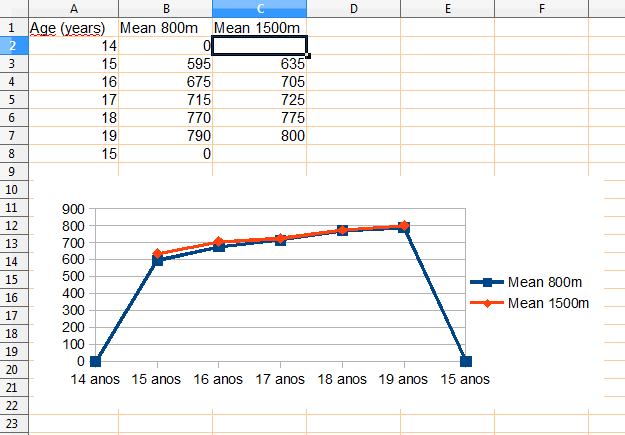
I’m need to create a Line Chat like this:
Note that there are space before and after of X Axis’ values
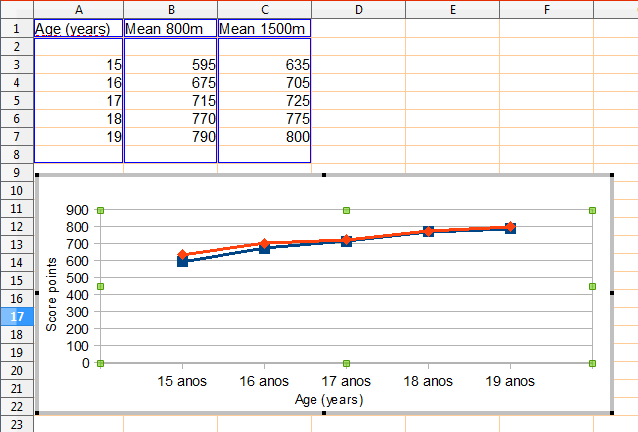
But, my chart is like this:
I tried to change the scale, it changed the values and it can’t happen.

Hello,
I’m need to create a Line Chat like this:
Note that there are space before and after of X Axis’ values
But, my chart is like this:
I tried to change the scale, it changed the values and it can’t happen.
I think there is an option to get a very near result.
Create line type chart adding a temporary labels and values prior and post the real labels and values for a temporary use, to force calc set properly the data ranges.

Add titles to axis and format X-axis as indicated by oweng, delete Legend.
After the chart is created delete the temporary labels/values .

@marosv - your trick with deleting the first and lost data point AFTER creating the chart is a pretty smart way.
I tried to ncluder empty cells in the data range and Calc neglected always the empty cells. Congratulations!
Thanks for this answer @mariosv. I did not think of manipulating the source data. Very good workaround. You can also edit the Y-axis to reduce the value range to 500-1000 as in the original question (Scale > Minimum / Maximum values).
@_edEr and @owen - I made a test and came to the conclusion that in Calc the chart @_edEr wants is not possible because in a line chart the position of the x-axis categories (15anos, 16anos,…) cannot not be placed between the little labels (little vertical strokes indicating the position of the x-axis values).
In the case of a column chart this is possible and Calc does it automatically.
From the mathematical point of view Calc creates the charts correct.
@_edEr - IMHO your first chart (with the spaces at start and end of the curve) is mathematically not correct for a line chart. The location of the data point (15anos/625) on the x-axis is not precise as it should.
I cannot read the name of the y-axis but I am of the impression that a column chart is mathematically the correct format.
First of all: @ROSt53 and @oweng, thanks for your answer.
This chart is not for me, is for a friend of mine.
About to use columns instead of lines: I tried, but this one still better and clearer. The first chart was made with MS Excel at school. In my home I don’t have it and I’m working in another company nowadays (and using just LibreOffice in both);
About “The location of the data point (15anos/625) on the x-axis is not precise as it should” by @ROSt53: I know that it could be more precise, but is not the idea. This one is just a “figure” for and table that describes all point.
This chart is just to compare 2 competitions, I have to do more 2 charts with the same idea. Untill now, I created as you see (2nd chart) and paste on Inkscape to “beautify”, and I add the spaces there. (is not what I would like to do, but works for now)
Again, I say thanks for your answer.