Attach a category to a number

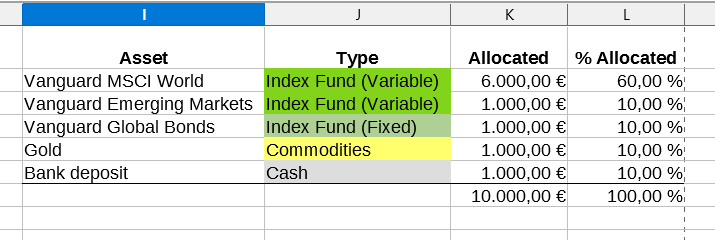
Hi, I would like to have a way to attach categories to an asset type, then display the % of how much there is allocated depending on the number in €.

You would enter for instance 6000€ on the “allocated” column, then automatically on the left on “% allocated” it would be %100 because that is all you’ve entered so far.

Then as you enter other assets and add the amounts, it calculates the % on the “% allocated” column.

And the asset class type would be to create a circular graphic, so you can quickly see “I have this % in index funds, this in commodities, this % in cash” etc.

I’ve sort of achieved this looking at video tutorials but im not sure if I did it correctly so before I enter the wrong amount to invest I would like someone experienced to post a a template if possible.

Thanks

I look at that and think that a pivot table might be called for. There are always other ways though.

In the attached spreadsheet on Sheet 1 you can add in rows between the top and bottom rows, enter the new data and copy down the formula for the percentages. You can then go to the Pivot table sheet, right-click on the pivot table and click Refresh. The spreadsheet is rudimentary but others might contribute something better.

Attach a category to a number.ods (25.0 KB)

1 Like

Seems to be working nicely, but I have a question. How do you add new categories? In sheet 1, I added a new asset that belongs to a new category, then how do I make it show up on the other sheet with the graphic?

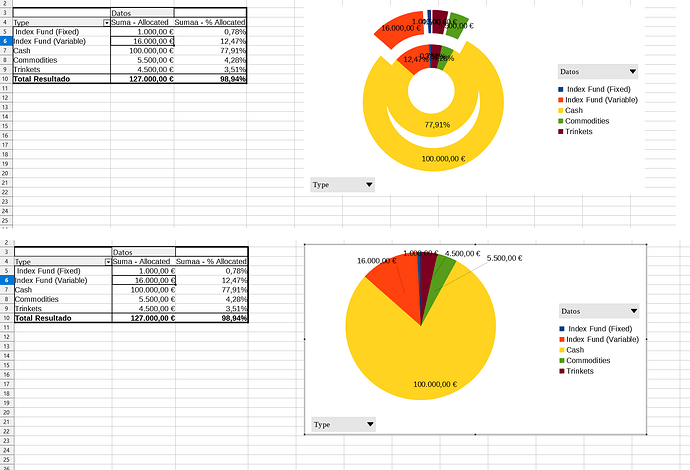
Also, something i’ve noticed is that when you have small % for some assets the circle becomes messed up so the numbers aren’t clearly readable, but the simple one looks fine:

but the simple circle lacks the %. Is it possible to show the %'s below the numbers? like, below 100.000,00 € on the second circle, show 77,91%. This way the numbers are spaced and readable.

I’ve realized the new entries weren’t showing up because they were below A10, so I had to do this:

change this
$Sheet1.$A$1:$D$10
to this
$Sheet1.$A$1:$D$12
So the new 2 entries showed.

Im trying to be able to swich between showing the % of each type and the % of each individual asset, perhaps better in another sheet. I’ve tried cloning the sheet and changing the way it collects the data to create the graph but its not working. I cannot add the “asset” row on the options of the dynamic table.

The idea would be to have 2 sheets to look at the portfolio.

Sheet 1: “allocated by class”
Sheet 2: “allocated by asset”

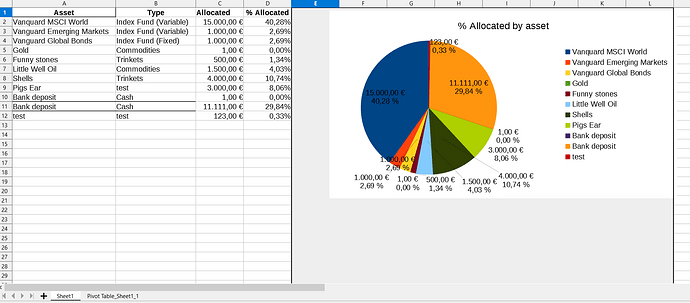
Edit: I was able to make it work somehow on the same Sheet 1 creating a simple graphic without the dynamic table. Do you spot any errors?

The reason I suggested a pivot table was to give a total for the Type of fund which I understood was the basis of the question.

To stop the numbers overlaying each other consider

  1. Formatting the Allocated amounts as number with no decimal places, that removes 5 characters and makes it easier to read.
  2. Reducing decimal places in the percentage, formatting to 1 or 0. Hundredths of a percent can impede understanding.

Yeah, I wanted both graphics, one that shows individual asset allocation %, and other that shows per category. Now im trying to get it sorted automatically by % allocated in descending order.

OK. Without pivot tables by using SUMIF. Also has data validation to ensure Type names are consistent and will be counted (should have been in pivot table spreadsheet).
Attach a category to a number3.ods (25.7 KB)

Insert rows between heading row and bottom row to extend the ranges if more items need to be added in any sheet, that way you will not have to manually extend the ranges.

BTW, there is an excellent Calc guide on the documentation pages